. 2005 Dec;79(24):15151-64.
doi: 10.1128/JVI.79.24.15151-15164.2005.

Transcription program of red sea bream iridovirus as revealed by DNA microarrays

Affiliations

Transcription program of red sea bream iridovirus as revealed by DNA microarrays

Dang Thi Lua et al. J Virol. 2005 Dec.

Abstract

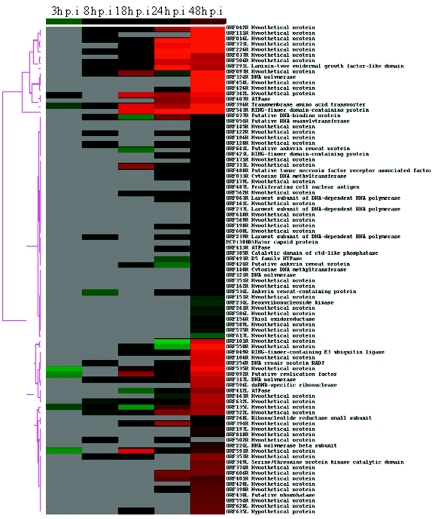
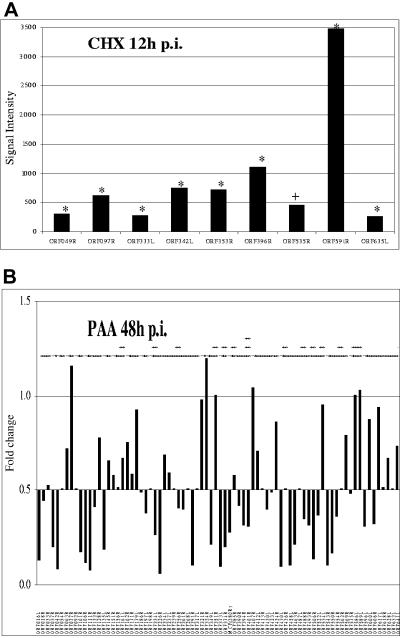
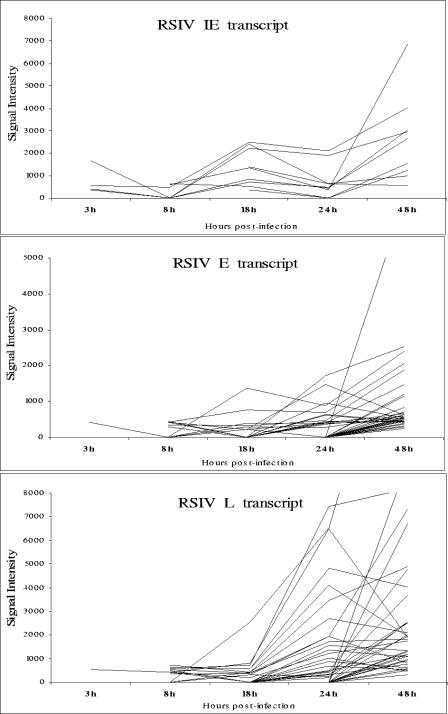
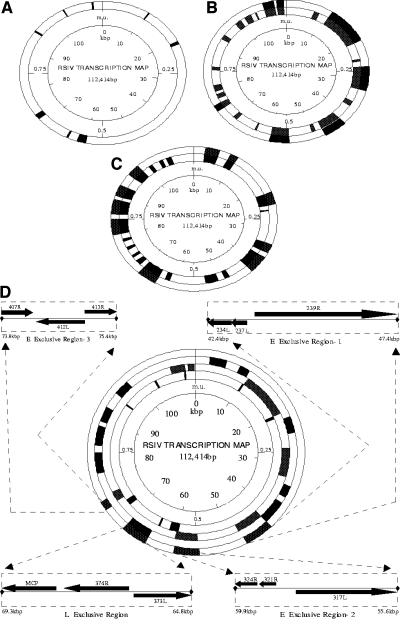
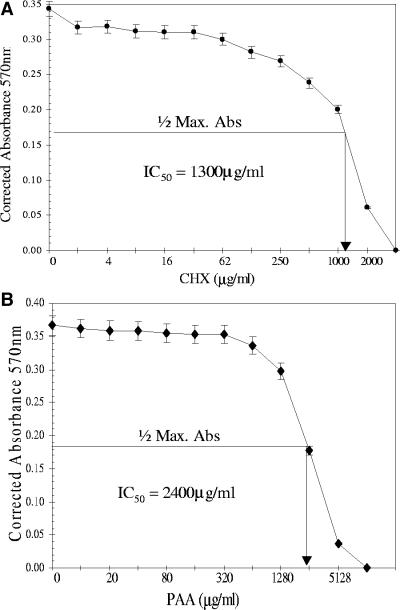
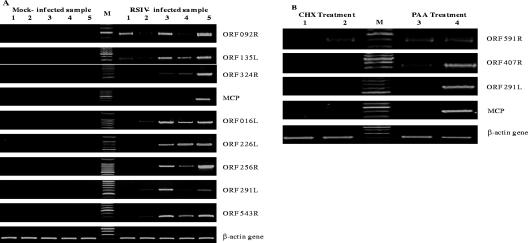
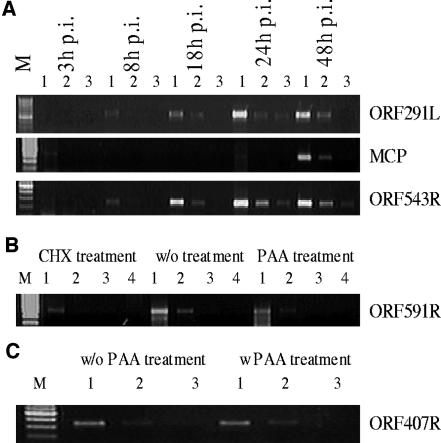
Red sea bream iridovirus (RSIV) has been identified as the causative agent of a serious disease in red sea bream and at least 30 other marine fish species. We developed a viral DNA microarray containing 92 putative open reading frames of RSIV to monitor the viral gene transcription program over the time course of an in vitro infection and to classify RSIV transcripts into temporal kinetic expression classes. The microarray analysis showed that viral genes commenced expression as early as 3 h postinfection (p.i.) and this was followed by a rapid escalation of gene expression from 8 h p.i. onwards. Based on the expression of some enzymes associated with viral DNA replication, the DNA replication of RSIV appeared to begin at around 8 h p.i. in infected cells in vitro. Using a de novo protein synthesis inhibitor (cycloheximide) and a viral DNA replication inhibitor (phosphonoacetic acid), 87 RSIV transcripts could be classified into three temporal kinetic classes: nine immediate-early (IE), 40 early (E), and 38 late (L) transcripts. The gene expression of RSIV occurred in a temporal kinetic cascade with three stages (IE, E, and L). Although the three classes of transcripts were distributed throughout the RSIV genome, E transcripts appeared to cluster in at least six discrete regions and L transcripts appeared to originate from seven discrete regions. The microarray data were statistically confirmed by using a t test, and were also clustered into groups based on similarity in the gene expression patterns by using a cluster program.


Figures

FIG. 1.
FIG. 1.
Hierarchical cluster analysis of the expression data of RSIV transcripts throughout infection in vitro. Calibrated expression ratios for each ORF were categorized by an average linkage hierarchical clustering program. Each row represents the expression profile of a single ORF, and each column indicates time points after infection. The normalized expression levels across all the time points are color-coded. Green boxes indicate expression ratios lower than the mean. Red boxes indicate expression ratios greater than the mean. Black boxes indicate an intermediate level of expression and gray boxes indicate missing or not detected. The magnitude of up-regulation from the mean is shown by differing intensities of red, with deep red showing lower expression and bright red showing the highest levels of expression.
FIG. 2.
FIG. 2.
Immediate-early, early, and late transcripts of RSIV. (A) Immediate-early transcripts of RSIV. HINAE cells were treated with CHX (50 μg/ml) 1 h prior to and throughout the RSIV infection and total RNA was isolated at 12 h p.i. The RSIV CHX-untreated and CHX-treated samples were labeled with Cy5 and Cy3-dUTP, respectively, and hybridized to the microarrays. RSIV IE transcripts were observed under CHX treatment. The signal intensity is calculated as the mean intensity of duplicate spots of each viral ORF minus the background signal. Statistical significance of changes in expression was assessed by paired t test (+, P > 0.05; *, P < 0.05) (B) Early and late transcripts of RSIV. HINAE cells were treated with PAA (100 μg/ml) 1 h prior to and throughout the RSIV infection and total RNA was isolated at 48 h p.i. The RSIV PAA-treated and RSIV-infected samples were labeled with Cy5- and Cy3-dUTP, respectively, and hybridized to the microarrays. The downward bars represent L genes whose expression levels were inhibited at least twofold (signal intensity ratios less than 0.5) by PAA treatment, while the upward bars represent E genes that were unaffected by PAA. The signal intensity ratio is calculated from the signal intensity of RSIV PAA-treated samples divided by the RSIV-infected samples. The experiment was performed in duplicate. The statistical significance of changes in expression was assessed by paired t test (+, P > 0.05; *, P < 0.05; **, P < 0.001; ***, P < 0.0001).
FIG. 3.
FIG. 3.
Time course expression analysis of three RSIV transcript classes.
FIG. 4.
FIG. 4.
Distribution of IE, E, and L transcripts in the RSIV genome and correlation with genomic sequence data. Transcriptionally active regions are shown in black, while inactive or undetected regions are shown in white. The innermost circle indicates map units (m.u.) and kilobases (kb) from map unit 0. (A) Distribution of IE transcripts in the RSIV genome. (B) Distribution of E transcripts in the RSIV genome. The inner solid circle shows regions of E transcription. The outer solid circle indicates major clusters of E transcription. (C) Distribution of L transcripts in the RSIV genome. The inner solid circle shows regions of L transcription. The outer solid circle indicates major clusters of L transcription. (D) Distribution of E and L exclusive regions in the RSIV genome. The three inner solid circles show major clusters of IE, E, and L transcription in the innermost, middle, and outermost circles, respectively. The outer solid circle indicates three regions exclusive to E transcripts encoding enzymes associated with viral DNA replication and an L region containing MCP. Potential ORFs are derived from genomic sequence data of Kurita et al. (28).
FIG. 5.
FIG. 5.
IC50 detection of CHX and PAA. The assays were performed with HINAE cells following the CellTiter 96 nonradioactive cell proliferation assay kit's protocol. IC50 values were determined by locating the drug treatment value corresponding to one-half the maximum absorbance (Max. Abs.) value. The y axis represents corrected absorbance values at 570 nm that were subtracted from the absorbance value of the positive control (100% lysed cells). The x axis represents concentrations of drug inhibitors on a log scale to plot against the corrected absorbance values. The concentrations were twofold dilutions, and each concentration was tested in quadruplicate. The assay of each drug was performed in duplicate. (A) IC50 detection of CHX. (B) IC50 detection of PAA.
FIG. 6.
FIG. 6.
RT-PCR analyses for RSIV transcripts. cDNAs were synthesized from 5 μg total RNA taken from the same samples used for the microarray hybridizations. One μl cDNA was used for 30-μl RT-PCR with cycling conditions as follows: an initial denaturation at 95°C for 3 min, followed by 27 to 30 cycles of denaturation at 95°C for 30 seconds, annealing at 56°C for 30 seconds, and elongation at 72°C for 1 min, and a final elongation step at 72°C for 5 min. (A) RT-PCR detection of RSIV transcripts at different time points after infection. Lane 1, 3 h p.i.; lane 2, 8 h p.i.; lane 3, 18 h p.i.; lane 4, 24 h p.i.; lane 5, 48 h p.i.; and lane M, 100-bp DNA ladder. (B) RT-PCR detection of RSIV transcripts under drug treatment. Lane 1, CHX-treated uninfected at 12 h p.i.; lane 2, CHX-treated RSIV-infected at 12 h p.i.; lane 3, PAA-treated and RSIV-infected at 48 h p.i.; lane 4, RSIV-infected at 48 h p.i.; and lane M, 100-bp DNA ladder.
FIG. 7.
FIG. 7.
Dilution RT-PCR analyses for RSIV transcripts. cDNAs were serially 10-fold diluted from the original cDNAs which were used as templates for RT-PCR amplification. Two microliters of diluted cDNA was used in a 30-μl dilution RT-PCR volume. Dilution RT-PCR conditions were the same as those used for RT-PCR. (A) Dilution RT-PCR analysis of RSIV transcripts at different time points after infection. Lane 1, 10−1 diluted cDNA; lane 2, 10−2 diluted cDNA; lane 3, 10−3 diluted cDNA; and lane M, 100-bp DNA ladder. (B) Dilution RT-PCR analysis of RSIV IE transcripts. Lane 1, 100 diluted cDNA; lane 2, 10−1 diluted cDNA; lane 3, 10−2 diluted cDNA; lane 4, 10−3 diluted cDNA; and lane M, 100-bp DNA ladder. (C) Dilution RT-PCR analysis of RSIV E transcripts. Lane 1, 100 diluted cDNA; lane 2, 10−1 diluted cDNA; lane 3, 10−2 diluted cDNA; and lane M, 100-bp DNA ladder).

Similar articles

Cited by

References

    1. Ahn, J. W., K. L. Powell, P. Kellam, and D. G. Alber. 2002. Gammaherpesvirus lytic gene expression as characterized by DNA array. J. Virol. 76:6244-6256. - PMC - PubMed
    1. Bigger, C. B., K. M. Brasky, and R. E. Lanford. 2001. DNA microarray analysis of chimpanzee liver during acute resolving hepatitis C virus infection. J. Virol. 75:7059-7066. - PMC - PubMed
    1. Bowtell, D., and J. Sambrook (ed.). 2002. DNA microarrays: a molecular cloning manual. Cold Spring Harbor Laboratory, Cold Spring Harbor, N.Y.
    1. Byon, J. Y., T. Ohira, I. Hirono, and T. Aoki. 2005. Use of a cDNA microarray to study immunity against viral hemorrhagic septicemia (VHS) in Japanese flounder (Paralichthys olivaceus) following DNA vaccination. Fish Shellfish Immunol. 18:135-147. - PubMed
    1. Caipang, C. M., I. Hirono, and T. Aoki. 2003. Development of a real-time PCR assay for the detection and quantification of red sea bream Iridovirus (RSIV). Fish Pathol. 38:1-7.

Publication types

MeSH terms

LinkOut - more resources