. 2005 Dec;79(24):15226-37.
doi: 10.1128/JVI.79.24.15226-15237.2005.

Modulation of HLA-G expression in human neural cells after neurotropic viral infections

Affiliations

Modulation of HLA-G expression in human neural cells after neurotropic viral infections

Monique Lafon et al. J Virol. 2005 Dec.

Abstract

HLA-G is a nonclassical human major histocompatibility complex class I molecule. It may promote tolerance, leading to acceptance of the semiallogeneic fetus and tumor immune escape. We show here that two viruses-herpes simplex virus type 1 (HSV-1), a neuronotropic virus inducing acute infection and neuron latency; and rabies virus (RABV), a neuronotropic virus triggering acute neuron infection-upregulate the neuronal expression of several HLA-G isoforms, including HLA-G1 and HLA-G5, the two main biologically active isoforms. RABV induces mostly HLA-G1, and HSV-1 induces mostly HLA-G3 and HLA-G5. HLA-G expression is upregulated in infected cells and neighboring uninfected cells. Soluble mediators, such as beta interferon (IFN-beta) and IFN-gamma, upregulate HLA-G expression in uninfected cells. The membrane-bound HLA-G1 isoform was detected on the surface of cultured RABV-infected neurons but not on the surface of HSV-1-infected cells. Thus, neuronotropic viruses that escape the host immune response totally (RABV) or partially (HSV-1) regulate HLA-G expression on human neuronal cells differentially. HLA-G may therefore be involved in the escape of certain viruses from the immune response in the nervous system.


Figures
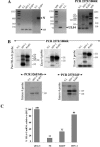
FIG. 1.
FIG. 1.
HSV-1 and RABV upregulate HLA-G gene transcription. Human postmitotic neurons (NT2-N) and human neuroblastoma (SK-N-SH) cells were mock infected (N.I.) or infected with HSV-1 for 18 h or with RABV for 24 h. (A) HSV-1 and RABV infection by RT-PCR was monitored, using pairs of primers specific for RABV N and for the UL54 gene of HSV-1. 18S, a housekeeping gene, was used for normalization. Results are shown for NT2-N cells. HLA-G transcript levels were analyzed in mock-infected (N.I.) and in HSV-1- or RABV-infected NT2-N cells by RT-PCR, using a pan-HLA-G primer, 257F/1004R. Bands corresponding to HLA-G5, -G1, -G6, -G2/G4, and -G3 were identified. The data shown are representative of at least three independent experiments. (B) The same extracts were used for hybridization. RT-PCR was carried out with the following primer pairs: 257F/1004R, 525F/i4b, and 257F/i4F. The PCR amplification products were hybridized with pan-HLA-G, exon 3-, and exon 4-specific probes for 257F/1004R and with the intron 4-specific probe for the 526/i4b and 57F/i4F primer pairs. Hybridization confirmed that the six HLA-G isoforms were present. (C) Real-time PCR analysis was performed with JEG-3 cells, an HLA-G-positive choriocarcinoma cell line, uninfected SK-N-SH cells, and RABV- or HSV-1-infected SK-N-SH cells. Results are expressed as percentages of the 100-fold increase obtained with JEG-3 cells.
FIG. 2.
FIG. 2.
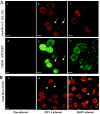
HSV-1 and RABV increase HLA-G expression in human neuroblastoma and astrocytoma cells. Neuroblastoma SK-N-SH/RA cells were mock infected or infected with HSV-1 for 1 day or with RABV for 2 days. HLA-G expression was monitored by UV microscopy or flow cytometry of fixed and permeabilized cells, using MEM-G/09, a MAb specific for the HLA-G1 and HLA-G5 isoforms (A), and 5A6G7, a MAb specific for the soluble HLA-G5 and G6 isoforms (B). (A) HLA-G (a, b, and c) were detected with MEM-G/09 in uninfected (a), HSV-1-infected (b), and RABV-infected (c) SK-N-SH/RA cells. Viral antigens were detected by using virus-specific Ab in uninfected (d), HSV-1-infected (e), and RABV-infected (f) cells. Both viruses increase HLA-G levels (b and c) over those in uninfected cultures (a). In infected cultures, HLA-G is expressed in both infected (green) and uninfected (arrows) SK-N-SH/RA cells. (B) HLA-G5/G6 was detected in mock-infected (a), HSV-1-infected (b), and RABV-infected (c) SK-N-SH/RA cells. HLA-G was detected in the nuclei and in the cytoplasm. Cytoplasmic accumulation was observed only in the cells of HSV-1- and RABV-infected cultures (arrowheads). In contrast, the nuclei were stained in both uninfected (a) and infected (b and c) neurons. Bars, 10 μm.
FIG. 3.
FIG. 3.
RABV triggers HLA-G surface expression in neuronal cells, whereas HSV-1 does not. (A) Surface HLA-G expression was detected by flow cytometry with MEM-G/09 MAb on uninfected (line) and RABV-infected (boldface line) SK-N-SH cells 2, 3, and 4 days after infection. Numbers at the top right of the panels indicate the SFI, calculated as described in Materials and Methods. On day 2, the SFI was 1.3. The percentage of cells with an SFI of >5 was 35% in infected cells and 27% in uninfected cells. On day 3, the SFI was 1.8. The percentage of cells with an SFI exceeding 5 was 26% in infected cultures and 14% in uninfected cultures. On day 4, the SFI was 2.1. The percentage of cells with an SFI of >5 was 43% in infected cultures and 20% in uninfected cultures. Percentages of infected cells were 10, 40, and 45 on days 2, 3, and 4, respectively. These kinetic analyses are representative of two independent experiments. (B) In HSV-1-infected cultures, HLA-G expression was detected by flow cytometry as described in the legend to panel A, on the surface of uninfected (line) and HSV-1-infected (boldface line) cells 1 and 2 days postinfection. On day 1, the SFI was 0.8. The percentage of cells with an SFI of >5 was 10% in infected cultures and 12% in uninfected cultures. On day 2, the SFI was 0.6. The percentage of cells with an SFI of >5 was 7% in infected cultures and 12% in uninfected cultures. These data are representative of two independent experiments.
FIG. 4.
FIG. 4.
RABV infection upregulates HLA-G in astrocytoma cells despite low levels of infection. Astrocytoma U373MG cells were infected with HSV-1 or RABV or were left uninfected. HLA-G levels were determined by flow cytometry in uninfected (NI panel) and HSV-1- and RABV-infected U373MG (HSV-1 and RABV panels) cells. Panel NI corresponds to the ratio of reactivity of MEM-G/09 MAb with uninfected U373MG (boldface line) versus that of an irrelevant isotype-matched MAb (line). Panels HSV-1 and RABV correspond to the ratio of HLA-G reactivity in infected U373MG (boldface line) to that in day-matched uninfected U373MG cultures (line). The numbers given are SFIs, calculated as described in Materials and Methods. SFI values of >1.25 were considered positive. For the day 1 HSV-1 culture, the SFI = 1.8. The percentage of cells with an SFI of >5 was 79% in infected cultures and 45% in uninfected cultures. For the day 2 RABV culture, the SFI = 2.1. The percentage of cells with an SFI of >5 was 27% in infected cultures and 13% in uninfected cultures. Only 8% of the total U373MG cell population was infected with RABV. These plots are representative of three independent experiments.
FIG. 5.
FIG. 5.
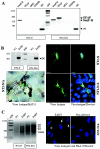
RABV infection increases HLA-G expression in infected neurons and in mixed cultures of human neurons and/or astrocytes. (A) Human NT2-N cultures contained only neurons, as demonstrated by detection of the high-molecular-weight neurofilament protein NeuF-H. The absence of glial cell contamination was demonstrated by the absence of GFAP transcripts, a marker of astrocytes; MOG, a marker of oligodendroyctes; and CD200R, a marker of microglia. In contrast (see the right-hand portion of the gel), NT2-N/A culture expressed both NeuF-H and GFAP transcripts, indicating that it contains both neurons and astrocytes. (B) NT2-N and NT2-N/A cultures are susceptible to RABV infection, as shown by PCR amplification of RABV N (647 bp). (Bottom, left) An RABV-infected NT2-N/A culture was doubled stained with an MAP-2-specific Ab (dark brown staining), an antiviral antigen Ab (viral Ag accumulation in green), and Hoechst stain (staining the nuclei blue). Neurons (MAP-2 positive; dark brown) were infected (green), whereas astrocytes (MAP-2 negative) were not. (Right) RABV-infected NT2-N and NT2-N/A cultures were doubled stained with Hoechst stain (blue nuclei) and antiviral antigen Ab (green). In both NT2-N (top) and NT2-N/A cultures (bottom), only neurons (typical neuron morphology) were infected (green), whereas astrocytes (large blue nuclei) were not. (C) HLA-G transcription in infected cells was compared with that in the corresponding mock-infected cells (N.I.) by RT-PCR, using G.257F/G.1004R pan HLA-G primers. RABV increased HLA-G transcript levels in infected NT2-N and NT2-N/A cells. The nature of cells expressing HLA-G in infected NT2-N/A cultures was analyzed by double immunocytochemistry, using an Ab specific for RABV antigen (green) and MEM-G/09, which is specific for the HLA-G1 and 5 isoforms. Nuclei were stained with Hoechst stain (blue). In addition to infected neurons (*), astrocytes (arrows) located close to infected neurons expressed HLA-G (red). Bars, 10 μm.
FIG. 6.
FIG. 6.
IFN-β, which is produced by RABV-infected cultures, increases HLA-G expression in NT2-N and NT2-N/A cultures. (A) The treatment of uninfected NT2-N or NT2-N/A cultures with 1,000 IU of rIFN-β stimulated HLA-G transcription in both cell types, as shown by PCR using the pan-HLA-G 257F/1004R primers. (B) The treatment of uninfected SK-N-SH with 500 IU of rIFN-β stimulated HLA-G surface expression as detected by cytofluorometry. The boldface line indicates HLA-G surface expression in IFN-γ-treated cells. The lighter line is used for untreated cells. (C, left) RABV infection increased IFN-β transcription in NT2-N and NT2-N/A cultures, as shown by PCR and real-time PCR (IFN-β expression levels were 121 and 199 times higher than that in uninfected NT2-N and NT2-N/A, respectively). (Right) RABV and HSV-1 infection triggered a modest increase of IFN-α5 transcription in NT2-N culture, as shown by PCR and real-time PCR. Real-time PCR results are given as relative fold increase compared to noninfected cultures (value, 1).

Similar articles

Cited by

References

    1. Alcami, A., and U. H. Koszinowski. 2000. Viral mechanisms of immune evasion. Trends Microbiol. 8:410-418. - PMC - PubMed
    1. Anglen, C. S., M. E. Truckenmiller, T. D. Schell, and R. H. Bonneau. 2003. The dual role of CD8+ T lymphocytes in the development of stress-induced herpes simplex encephalitis. J. Neuroimmunol. 140:13-27. - PubMed
    1. Baloul, L., S. Camelo, and M. Lafon. 2004. Up-regulation of Fas ligand (FasL) in the central nervous system: a mechanism of immune evasion by rabies virus. J. Neurovirol. 10:372-382. - PubMed
    1. Becher, B., A. Prat, and J. P. Antel. 2000. Brain-immune connection: immuno-regulatory properties of CNS-resident cells. Glia 29:293-304. - PubMed
    1. Cabello, A., A. Rivero, M. J. Garcia, J. M. Lozano, J. Torre-Cisneros, R. Gonzalez, G. Duenas, M. D. Galiani, A. Camacho, M. Santamaria, R. Solana, C. Montero, J. M. Kindelan, and J. Pena. 2003. HAART induces the expression of HLA-G on peripheral monocytes in HIV-1 infected individuals. Hum. Immunol. 64:1045-1049. - PubMed