. 2005 Dec;79(24):15405-16.
doi: 10.1128/JVI.79.24.15405-15416.2005.

Overexpression of tumor necrosis factor alpha by a recombinant rabies virus attenuates replication in neurons and prevents lethal infection in mice

Affiliations

Overexpression of tumor necrosis factor alpha by a recombinant rabies virus attenuates replication in neurons and prevents lethal infection in mice

Milosz Faber et al. J Virol. 2005 Dec.

Abstract

The effect of tumor necrosis factor alpha (TNF-alpha) on rabies virus (RV) infection of the mouse central nervous system (CNS) was studied, using recombinant RV engineered to express either soluble TNF-alpha [SPBN-TNF-alpha+] or insoluble membrane-bound TNF-alpha [SPBN-TNF-alpha(MEM)]. Growth curves derived from infections of mouse neuroblastoma NA cells revealed significantly less spread and production of SPBN-TNF-alpha+ than of SPBN-TNF-alpha(MEM) or SPBN-TNF-alpha-, which carries an inactivated TNF-alpha gene. The expression of soluble or membrane-bound TNF-alpha was not associated with increased cell death or induction of alpha/beta interferons. Brains of mice infected intranasally with SPBN-TNF-alpha+ showed significantly less virus spread than did mouse brains after SPBN-TNF-alpha- infection, and none of the SPBN-TNF-alpha+-infected mice succumbed to RV infection, whereas 80% of SPBN-TNF-alpha- -infected mice died. Reduced virus spread in SPBN-TNF-alpha+-infected mouse brains was paralleled by enhanced CNS inflammation, including T-cell infiltration and microglial activation. These data suggest that TNF-alpha exerts its protective activity in the brain directly through an as yet unknown antiviral mechanism and indirectly through the induction of inflammatory processes in the CNS.


Figures
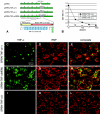
FIG. 1.
FIG. 1.
Expression of TNF-α by recombinant RV. (A) Schematic of RV-TNF-α recombinant constructs. The pSPBN vector was derived from SN by removing the Ψ gene and introducing BsiWI and NheI sites between the G and L genes. Mouse TNF-α cDNA was amplified by PCR, with the introduction of BsiWI and NheI sites, and was ligated into pSPBN, resulting in pSPBN-TNF-α(+). In pSPBN-TNF-α(MEM), the proteolytic cleavage site of TNF-α was removed by deleting the coding sequence for the first nine amino acids of soluble TNF-α and exchanging the lysine at position 11 with glutamic acid, as described in Materials and Methods. To construct pSPBN-TNF-α(−), the first seven ATG codons of the TNF-α gene were mutated. (B) TNF-α production in BSR cells. BSR cells were infected with SPBN-TNF-α(−), SPBN-TNF-α(MEM), or SPBN-TNF-α(+) at an MOI of 0.1 and incubated at 37°C. TNF-α secreted into the tissue culture supernatants of infected BSR cells was measured at 24 h p.i., using ELISA. OD, optical density. (C to L) Confocal double-immunofluorescence microscopy of TNF-α (green, panels C, F, and I) and rabies ribonucleocapsid (RNP) (red, panels D, G, and K) in NA cells infected with SPBN-TNF-α(+), SPBN-TNF-α(MEM), or SPBN-TNF-α(−). Panels E, H, and L show the composites of TNF-α and RNP double immunofluorescence. Note that TNF-α is absent only in NA cells infected with SPBN-TNF-α(−) (panels I and L).
FIG. 2.
FIG. 2.
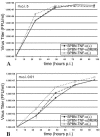
Growth of TNF-α-expressing recombinant RV in NA cells. NA cells were infected with SPBN-TNF-α(−), SPBN-TNF-α(MEM), or SPBN-TNF-α(+) at an MOI of 5 (A) or 0.01 (B) and incubated at 34°C. At the indicated times p.i., viruses were harvested and titrated. All titrations were carried out in quadruplicate, and titers are expressed as mean values ± SEM. The statistical significance among titers produced by the different recombinant RVs was determined using one-way ANOVA with the Newman-Keuls multiple comparison test.
FIG. 3.
FIG. 3.
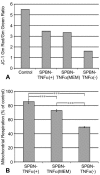
Effect of TNF-α expressed by recombinant RV infection on mitochondrial membrane potential (A) and mitochondrial respiration (B) in mouse neuroblastoma NA cells. (A) Flow cytometry of noninfected (control) and infected NA cells labeled with JC-1. The mitochondrial membrane potential is expressed as the ratio of the geometric means (Gm) of red (JC-1 aggregates) and green (JC-1 monomers) fluorescence intensities. (B) Mitochondrial respiration in NA cells infected with recombinant RV was determined using the MTT assay described in Materials and Methods. Data are expressed as mean values ± SEM; asterisks indicate significant differences (***, P < 0.001) between experimental groups. Statistical significance was determined using one-way ANOVA with the Newman-Keuls multiple comparison test.
FIG. 4.
FIG. 4.
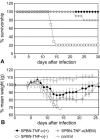
Effect of intranasal infection with TNF-α-expressing recombinant RV on survival (A) and body weight (B) of TNF-α KO mice. Mice were infected i.n. with 105 FFU of SPBN-TNF-α(−), SPBN-TNF-α(+), or SPBN-TNF-α(MEM) or with saline (control). Mortality and body weight were recorded daily.
FIG. 5.
FIG. 5.
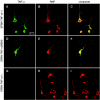
Expression of TNF-α (green) in cerebral neurons infected with SPBN-TNF-α(+) (A to C) or SPBN-TNF-α(MEM) (D to F), but not in SPBN-TNF-α(−)-infected neurons (G to I), on day 10 p.i. in the cortexes of TNF-α KO mice. High-power double-immunofluorescence laser scanning microscopic images of TNF-α (green) and rabies ribonucleocapsid (RNP, red) expression are shown.
FIG. 6.
FIG. 6.
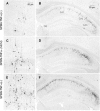
Detection of RV-infected neurons in the brain. The images show the presence of rabies virus RNP in neurons of the cortexes (A, C, E) and the CA1-to-CA3 region of the hippocampal formations (B, D, F) of TNF-α KO mice on day 10 after infection with SPBN-TNF-α(+), SPBN-TNF-α(MEM), or SPBN-TNF-α(−). Bright-field microscopy of immunostained brain sections is shown. DG, dentate gyrus; CA, CA region of hippocampus. Quantitation of rabies virus-infected neurons (RNP) in the cerebral cortexes (G) and the CA1-to-CA3 region of the hippocampal formations (H) of TNF-α KO mice infected with SPBN-TNF-α(+), SPBN-TNF-α(MEM), or SPBN-TNF-α(−) was done at 10 days p.i. Data are expressed as mean values ± SEM; asterisks indicate significant differences (***, P < 0.001) between experimental groups, as calculated by ANOVA.
FIG. 6.
FIG. 6.
Detection of RV-infected neurons in the brain. The images show the presence of rabies virus RNP in neurons of the cortexes (A, C, E) and the CA1-to-CA3 region of the hippocampal formations (B, D, F) of TNF-α KO mice on day 10 after infection with SPBN-TNF-α(+), SPBN-TNF-α(MEM), or SPBN-TNF-α(−). Bright-field microscopy of immunostained brain sections is shown. DG, dentate gyrus; CA, CA region of hippocampus. Quantitation of rabies virus-infected neurons (RNP) in the cerebral cortexes (G) and the CA1-to-CA3 region of the hippocampal formations (H) of TNF-α KO mice infected with SPBN-TNF-α(+), SPBN-TNF-α(MEM), or SPBN-TNF-α(−) was done at 10 days p.i. Data are expressed as mean values ± SEM; asterisks indicate significant differences (***, P < 0.001) between experimental groups, as calculated by ANOVA.
FIG.7.
FIG.7.
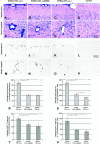
Identification of cell infiltrates in recombinant RV-infected brains. The top and middle panels show Giemsa-stained brain sections (A to H) and CD3-immunostained brain sections (I to P) demonstrating leukocyte and T-cell infiltration, respectively, in the brains of TNF-α KO mice on day 10 after infection with SPBN-TNF-α(+), SPBN-TNF-α(MEM), or SPBN-TNF-α(−). Quantification of the numbers of infiltrated leukocytes (R and S) and CD3+ T cells (T and U) within the leptomeninx of the brain surfaces (R and T) and in perivascular areas of parenchymal blood vessels (S and U) of TNF-α KO mice infected with SPBN-TNF-α(+), SPBN-TNF-α(MEM), or SPBN-TNF-α(−) is shown in the graphs. Data are expressed as mean values ± SEM; asterisks indicate significant differences (*, P < 0.05; **, P < 0.01; ***, P < 0.001) between the indicated experimental groups, as calculated by ANOVA.
FIG. 8.
FIG. 8.
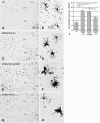
(A to H) Immunohistochemical analysis of Iba1-positive microglial cells in the hippocampuses of TNF-α KO mice at 10 days p.i. Microglial cells in noninfected control animals (A and B) show the typical ramified phenotype of resting microglia. (E and F) Activated microglial cells in mice infected with SPBN-TNF-α(+) (C and D) and SPBN-TNF-α(MEM). (G and H) Activated microglial cells with a more ameboid morphology in SPBN-TNF-α(−)-infected brains. CA, CA region of hippocampus; CC, corpus callosum; D3V, dorsal third ventricle; DG, dentate gyrus. (I) Measurement of the areas of Iba1-positive microglial cells in the hippocampuses of noninfected control (ctrl) and RV-infected TNF-α KO mice on day 10 p.i. Data represent the means ± SEM of Iba1-immunopositive areas measured in 100 μm2 of the hippocampal area. Three mice per group and six hippocampal tissue slices per mouse were used for the digital image analysis. Asterisks indicate significant differences (*, P < 0.05; **, P < 0.01; ***, P < 0.001) between the indicated experimental groups. #, significant differences (#, P < 0.05; ##, P < 0.01; ###, P < 0.001) between the noninfected control group and the indicated experimental groups, as calculated by ANOVA.

Similar articles

Cited by

References

    1. Alberti, L., M. C. Thomachot, T. Bachelot, C. Menetrier-Caux, I. Puisieux, and J. Y. Blay. 2004. IL-6 as an intracrine growth factor for renal carcinoma cell lines. Int. J. Cancer 111:653-661. - PubMed
    1. Ayoub, A. E., and A. K. Salm. 2003. Increased morphological diversity of microglia in the activated hypothalamic supraoptic nucleus. J. Neurosci. 23:7759-7766. - PMC - PubMed
    1. Bette, M., O. Kaut, M. K. Schafer, and E. Weihe. 2003. Constitutive expression of p55TNFR mRNA and mitogen-specific up-regulation of TNF alpha and p75TNFR mRNA in mouse brain. J. Comp. Neurol. 465:417-430. - PubMed
    1. Bette, M., M. K.-H. Schäfer, N. van Rooijen, E. Weihe, and B. Fleischer. 1993. Distribution and kinetics of superantigen-induced cytokine gene expression in mouse spleen. J. Exp. Med. 178:1531-1539. - PMC - PubMed
    1. Biermer, M., R. Puro, and R. J. Schneider. 2003. Tumor necrosis factor alpha inhibition of hepatitis B virus replication involves disruption of capsid integrity through activation of NF-kappaB. J. Virol. 77:4033-4042. - PMC - PubMed

Publication types

MeSH terms

Substances