Comparative Study
. 2005 Nov 25:6:67.
doi: 10.1186/1471-2202-6-67.

Callosal connections of dorsal versus ventral premotor areas in the macaque monkey: a multiple retrograde tracing study

Affiliations
Comparative Study

Callosal connections of dorsal versus ventral premotor areas in the macaque monkey: a multiple retrograde tracing study

Driss Boussaoud et al. BMC Neurosci. .

Abstract

Background: The lateral premotor cortex plays a crucial role in visually guided limb movements. It is divided into two main regions, the dorsal (PMd) and ventral (PMv) areas, which are in turn subdivided into functionally and anatomically distinct rostral (PMd-r and PMv-r) and caudal (PMd-c and PMv-c) sub-regions. We analyzed the callosal inputs to these premotor subdivisions following 23 injections of retrograde tracers in eight macaque monkeys. In each monkey, 2-4 distinct tracers were injected in different areas allowing direct comparisons of callosal connectivity in the same brain.

Results: Based on large injections covering the entire extent of the corresponding PM area, we found that each area is strongly connected with its counterpart in the opposite hemisphere. Callosal connectivity with the other premotor areas, the primary motor cortex, prefrontal cortex and somatosensory cortex varied from one area to another. The most extensive callosal inputs terminate in PMd-r and PMd-c, with PMd-r strongly connected with prefrontal cortex. Callosal inputs to PMv-c are more extensive than those to PMv-r, whose connections are restricted to its counterpart area. Quantitative analysis of labelled cells confirms these general findings, and allows an assessment of the relative strength of callosal inputs.

Conclusion: PMd-r and PMv-r receive their strongest callosal inputs from their respective counterpart areas, whereas PMd-c and PMv-c receive strong inputs from heterotopic areas as well (namely from PMd-r and PMv-r, respectively). Finally, PMd-r stands out as the lateral premotor area with the strongest inputs from the prefrontal cortex, and only the PMd-c and PMv-c receive weak callosal inputs from M1.


Figures

Figure 1
Figure 1
Premotor areas represented on a two-dimensional map of the cortex. On the left, surface view of the anterior part of the right hemisphere. The rectangle indicates the cortical region flattened and shown on the right. On the 2-D map, sulci are represented by shaded zones, the dashed lines indicate the fundus of the sluci. The premotor subdivisions are defined on the basis of SMI-32 staining (see text). Abbreviations: Ar, arcuate sulcus; Ce, central sulcus; CgG, cingulate gyrus; Ci, cingulate sulcus; CMA-d, r and v, dorsal rostral and ventral parts of the cingulate motor area, respectively; P = sulcus principalis; M1, primary motor cortex; PMd-c, r, caudal and rostral parts of the dorsal premotor cortex; PMv-c, r, caudal and rostral parts of the ventral premotor cortex; pre-SMA, rostral part of the SMA; SMA-proper, caudal part of the SMA.
Figure 2
Figure 2
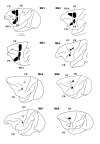
Reconstruction of the injection sites on a lateral view of the left hemisphere of the 8 monkeys included in the present study. Tracers: biotinylated dextran amine (BDA), diamidino yellow (DY), fast blue (FB), fluoro ruby (FR), cholera-toxin B subunit (CB). For other abbreviations, see Fig. 1.
Figure 3
Figure 3
Photomicrographs showing SMI-32 staining observed in Mk2 or Mk3 illustrating transition zones between the prefrontal cortex (Pfc) and PMv-r (panel A), between PMd-c and M1 (panel B), between PMv-r and ProM (panel C) and PMv-c and SomC (panel D). See list of abbreviations. Scale bar = 1 mm.
Figure 4
Figure 4
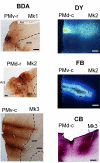
Photomicrographs of typical injection sites for BDA (left column) and for DY, FB and CB (from top to bottom in the right column). Scale bar = 1 mm.
Figure 5
Figure 5
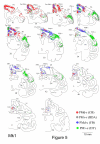
Frontal sections of the right hemisphere of Mk1, arranged from rostral to caudal with increasing ID# (10 to 54), showing the distribution of retrogradely labelled neurons as a result of tracers injections in the opposite PMd-r (red dots), PMv-r (grey dots), PMd-c (blue dots) and PMv-c (green dots). The tracers used are indicated in the bottom right. Tracers: biotinylated dextran amine (BDA), diamidino yellow (DY), fast blue (FB), cholera-toxin B subunit (CB). See list of abbreviations.
Figure 6
Figure 6
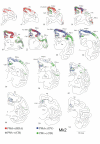
Frontal sections of the right hemisphere of Mk2, showing the distribution of retrogradely labelled neurons as a result of tracers injections in the opposite PMd-r (red dots), PMv-r (grey dots), PMd-c (blue dots) and PMv-c (green dots). Same conventions as in Figure 5.
Figure 7
Figure 7
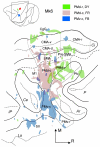
Distribution of labelling after 3 injections in Mk6 illustrated on a 2-D map of the frontal cortex. Same abbreviations and conventions as in Fig. 1.
Figure 8
Figure 8
A: quantitative data giving the percent distribution of callosal neurons observed in different cortical areas as a result of tracer injections made in PMd-r (top left plot), PMd-c (top right plot), PMv-r (bottom left plot) and PMv-c (bottom right plot). The percent values are given by different symbols for each of the three individual monkeys included in the quantitative analysis (Mk1, Mk2 and Mk3). For a given monkey, the sum of the percent values is 100%. B: for comparison, same data, but for the distribution of callosal neurons projecting to pre-SMA and SMA-proper for other monkeys (taken from [63]).
Figure 9
Figure 9
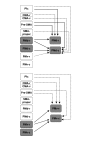
Summary diagram of callosal projections from premotor areas and prefrontal cortex to dorsal and ventral premotor sectors. Thin lines depict strong to moderate projections, dotted lines represent weak projections.

References

    1. Jones EG, Coulter JD, Hendry SHC. Intracortical connectivity of architectonic fields in the somatic sensory, motor and parietal cortex of monkeys. J Comp Neurol. 1978;181:263–291. doi: 10.1002/cne.901810206. - DOI - PubMed
    1. Kurata K. Corticocortical inputs to the dorsal and ventral aspects of the premotor cortex of macaque monkeys. Neurosci Res. 1991;12:263–280. doi: 10.1016/0168-0102(91)90116-G. - DOI - PubMed
    1. Kurata K, Hoffman DS. Differential effects of muscimol microinjection into dorsal and ventral aspects of the premotor cortex of monkeys. J Neurophysiol. 1994;71:1151–1164. - PubMed
    1. Kurata K. Site of origin of projections from the thalamus to dorsal versus ventral aspects of the premotor cortex of monkeys. Neurosci Res. 1994;21:71–76. doi: 10.1016/0168-0102(94)90069-8. - DOI - PubMed
    1. Preuss TM, Stepniewska I, Kaas JH. Movement representation in the dorsal and ventral premotor areas of owl monkeys: A microstimulation study. J Comp Neurol. 1996;371:649–675. doi: 10.1002/(SICI)1096-9861(19960805)371:4<649::AID-CNE12>3.0.CO;2-E. - DOI - PubMed

Publication types

MeSH terms

Substances