. 2006 Jan;7(1):83-92.
doi: 10.1038/ni1289. Epub 2005 Nov 27.

Visualizing regulatory T cell control of autoimmune responses in nonobese diabetic mice

Affiliations

Visualizing regulatory T cell control of autoimmune responses in nonobese diabetic mice

Qizhi Tang et al. Nat Immunol. 2006 Jan.

Abstract

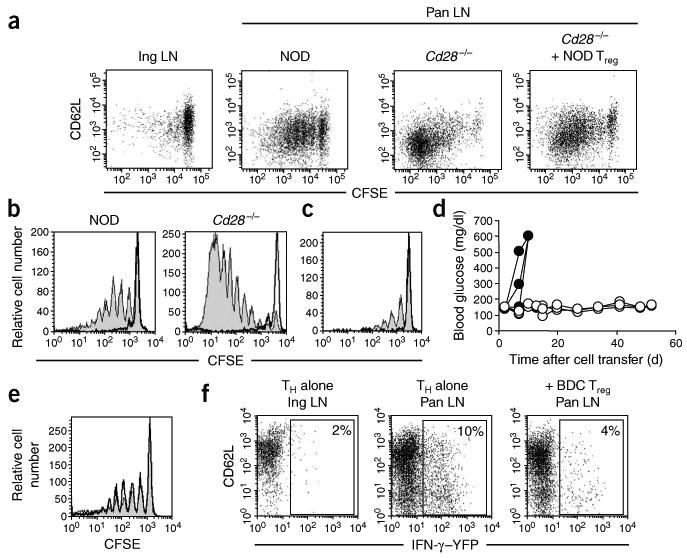
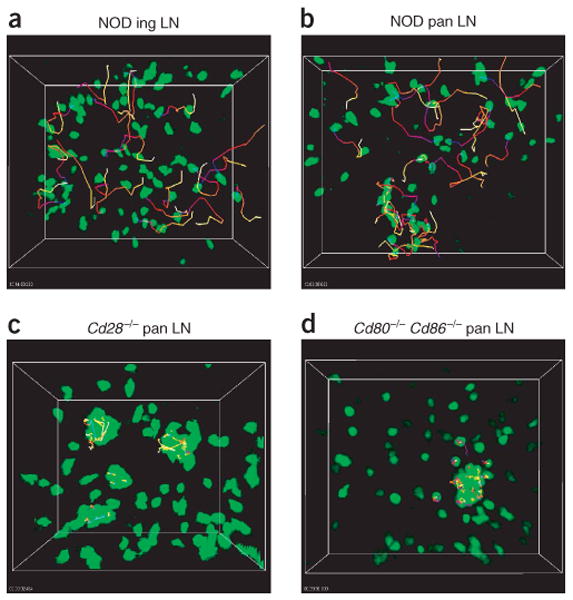
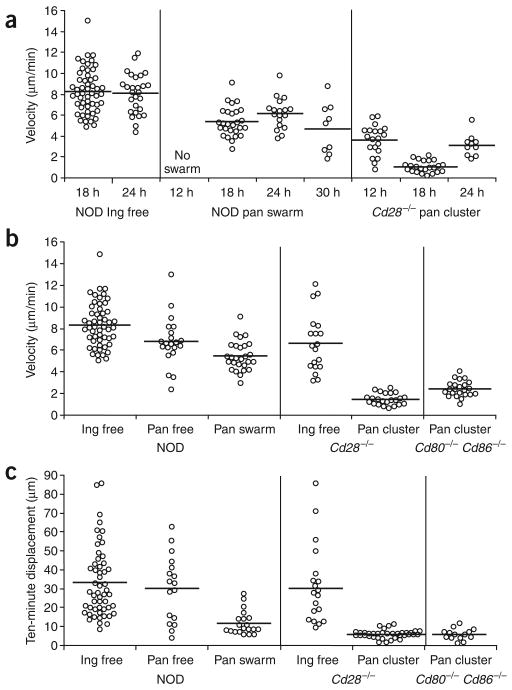
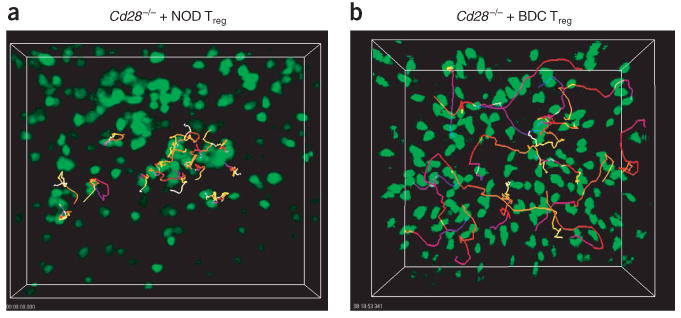
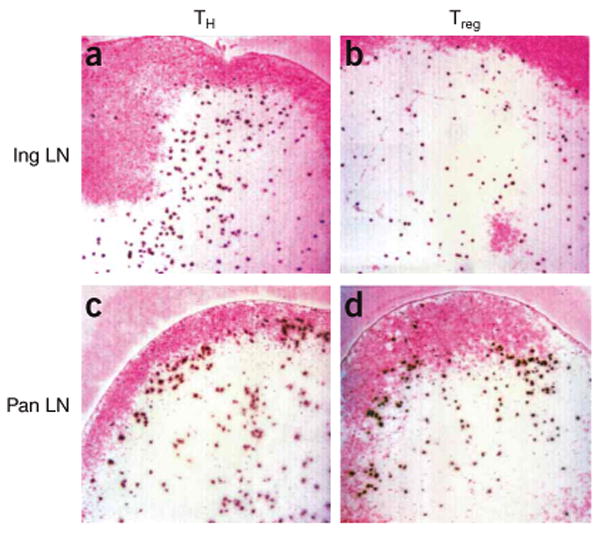
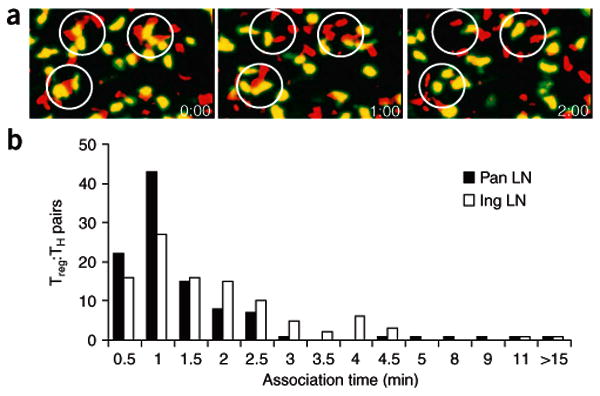
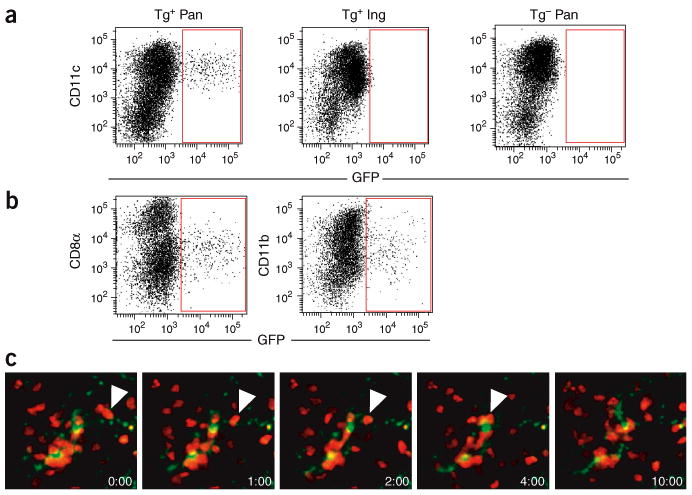
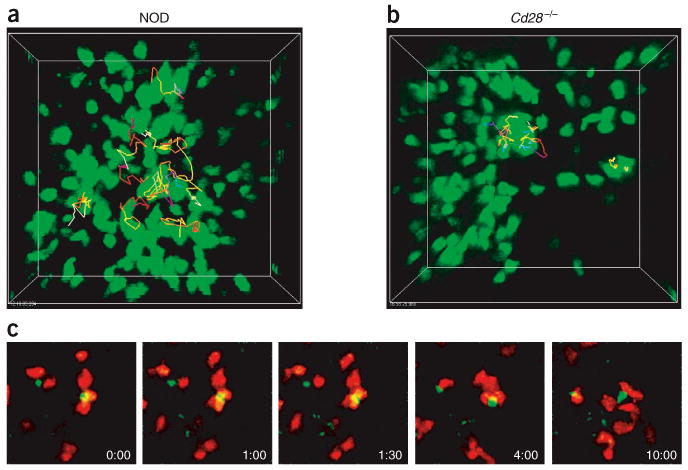
The in vivo mechanism of regulatory T cell (T(reg) cell) function in controlling autoimmunity remains controversial. Here we have used two-photon laser-scanning microscopy to analyze lymph node priming of diabetogenic T cells and to delineate the mechanisms of T(reg) cell control of autoimmunity in vivo. Islet antigen-specific CD4(+)CD25(-) T helper cells (T(H) cells) and T(reg) cells swarmed and arrested in the presence of autoantigens. These T(H) cell activities were progressively inhibited in the presence of increasing numbers of T(reg) cells. There were no detectable stable associations between T(reg) and T(H) cells during active suppression. In contrast, T(reg) cells directly interacted with dendritic cells bearing islet antigen. Such persistent T(reg) cell-dendritic cell contacts preceded the inhibition of T(H) cell activation by dendritic cells, supporting the idea that dendritic cells are central to T(reg) cell function in vivo.


Conflict of interest statement

COMPETING INTERESTS STATEMENT: The authors declare that they have no competing financial interests.

Figures

Figure 1
Figure 1
Treg cells suppress the priming of islet antigen–specific CD4+CD25 TH cells in the pancreatic lymph node. (a) CD62L expression and CFSE profiles of CFSE-labeled BDC2.5.Thy-1.1 CD4+CD25 TH cells transferred into NOD (n = 10), NOD.Cd28−/− (n = 10) and Treg cell–reconstituted NOD.Cd28−/− mice (far right; n = 4). Transferred cells in inguinal lymph nodes (Ing LN) of NOD recipients and pancreatic lymph nodes (Pan LN) of all recipients were analyzed. (b,c) CFSE profiles of transferred cells in the pancreatic lymph nodes of NOD and NOD.Cd28−/− mice injected with BDC2.5 Treg cells (bold histograms) or left untreated (filled histograms) 2 d before adoptive transfer of CFSE-labeled Thy-1.1+ BDC2.5 CD4+CD25 TH cells (b) or Thy-1.1+ 4.1 CD4+CD25 TH cells (c). (d) Nonfasting blood glucose of NOD.Rag1−/− mice given CD4+CD25 TH cells from 4.1 TCR-transgenic mice; cells were transferred alone (filled symbols) or together with BDC2.5 Treg cells (open symbols). (e) CFSE profiles of CD4+Thy-1.1+ cells in the pancreatic lymph nodes of NOD mice (n = 10) injected with CFSE-labeled Thy-1.1+ BDC2.5 CD4+CD25 TH cells alone (filled histograms) or together with BDC2.5 Treg cells (bold histograms). (f) YFP expression on CD4+Thy-1.1+ cells in the inguinal and pancreatic lymph nodes of NOD mice (n = 10) given CD4+CD25 TH cells from BDC2.5.Thy-1.1.Yeti mice; cells were transferred alone (CD4+CD25 TH alone) or together with BDC2.5 Treg cells (+BDC Treg). Numbers in dot plots indicate the percentage of YFP+ cells. Data are representative of three or more experiments.
Figure 2
Figure 2
Movement dynamics of BDC2.5 CD4+CD25 TH cells in explanted lymph nodes. Lymph nodes were collected for imaging 24 h and 18 h after transfer of CFSE-labeled BDC2.5 CD4+CD25 TH cells into NOD (a,b), NOD.Cd28−/− (c), and NOD.Cd80−/−Cd86−/− (d) recipients, respectively. Time-lapse images were obtained and the positions of individual cells over time were identified with Imaris tracking software. Images present the trajectories for some randomly selected cells.; tracks are ‘color-coded’ to indicate time progression from the beginning (blue) to the end (yellow) of imaging. Data are representative of five or more independent experiments, except d, which is two experiments.
Figure 3
Figure 3
Quantitative characterization of movement dynamics of BDC2.5 CD4+CD25 TH cells. Movements of individual cells in the inguinal and pancreatic lymph nodes were tracked for 10–30 min as described in Figure 2. The average velocity and 10-min displacement (distance from the origin at time 0) for each cell was calculated and plotted. Each circle represents one cell; horizontal lines indicate the mean of the group. (a) Velocities of free-moving BDC2.5 CD4+CD25 TH cells in NOD inguinal lymph nodes (NOD ing), swarming cells in NOD pancreatic lymph nodes (NOD pan swarm) and clustering and arrested cells in Cd28−/− pancreatic lymph nodes (NOD.Cd28−/− pan cluster), determined at various times after cell transfer. (b) Velocities of BDC2.5 CD4+CD25 TH cells showing various movement patterns (free, swarm, cluster) in inguinal (Ing) and pancreatic (Pan) lymph nodes at 18 h after cell transfer. Velocities for the NOD.Cd28−/− and NOD.Cd80−/−Cd86−/− clustering cells are significantly lower than for all other groups (P < 0.001) but are not significantly different from each other (P > 0.05). Velocities of the swarming cells in the NOD pancreatic lymph node are not significantly different from those of the free-moving cells (P > 0.05) but are significantly higher than those of the clustering cells in the NOD.Cd28−/− and NOD.Cd80−/−Cd86−/− groups (P < 0.001). (c) Ten-minute displacement of the BDC2.5 CD4+CD25 TH cells in b. Displacement values for the swarming cells in the NOD pancreatic lymph nodes and the clustering cells in the NOD.Cd28−/− and NOD.Cd80−/−Cd86−/− mice are significantly lower than those of all other groups (P < 0.001) but are not significantly different from each other (P > 0.05). No other comparisons showed statistically significant differences. Data are pooled from multiple experiments.
Figure 4
Figure 4
Treg cells alter the movement dynamics of BDC2.5 CD4+CD25 TH cells in explanted lymph nodes. BDC2.5 CD4+CD25 TH cell movement in NOD.Cd28−/− mice reconstituted with NOD Treg cells (a) or BDC2.5 Treg cells (b). Pancreatic lymph nodes were collected for imaging between 12 and 24 h after transfer of CFSE-labeled BDC2.5 CD4+CD25 TH cells. Time-lapse images were collected at 30-second intervals for 30 min and the positions of individual cells over time were identified with Imaris tracking software. Trajectories of selected cells are ‘color-coded’ to indicate time progression from the beginning (blue) to the middle (red) to the end (yellow) of imaging. Data are representative of two (a) or three or more (b) independent experiments.
Figure 5
Figure 5
Autoreactive CD4+CD25 TH cells and Treg cells from BDC2.5 mice home to the T cell zone and preferentially accumulate at the T cell–B cell boundary in the presence of autoantigen. CFSE-labeled BDC2.5 CD4+CD25 TH cells (a,c) and Treg cells (b,d) were transferred into NOD.Cd28−/− mice and the distribution of the transferred cells in inguinal lymph nodes (a,b) and pancreatic lymph nodes (c,d) was analyzed by immunohistochemistry 12 h later. B cell zones were labeled with anti-B220 staining and were developed with Fast Red (pink). Transferred cells were identified with anti-fluorescein developed with diaminobenzidine (dark brown). Results are representative of at least four mice in each group from independent experiments.
Figure 6
Figure 6
In vivo suppression by Treg cells is not associated with stable Treg cell–TH cell interactions. CFSE-labeled BDC2.5 CD4+CD25 TH cells were transferred into NOD.Cd28−/− mice 48 h after injection of CMTMR-labeled BDC2.5 Treg cells, and the movement of both cell types in explanted pancreatic and inguinal lymph nodes was monitored by time-lapse imaging with TPLSM 24 h after transfer of CD4+CD25 TH cells. (a) Time-lapse images of BDC2.5 CD4+CD25 TH cells (yellowish green) and Treg cells (red) in pancreatic lymph nodes, with Treg cell–TH cell aggregation circled at the beginning of imaging (time is in minutes:seconds). (b) Association time of 102 randomly selected Treg cell–TH cell pairs in pancreatic (filled symbols) and inguinal (open symbol) lymph nodes; numbers of pairs with various aggregation time are plotted. Data are representative of one of three independent experiments.
Figure 7
Figure 7
Islet antigen–bearing DCs form stable interaction with BDC2.5 CD4+CD25 TH cells. (a,b) Flow cytometry of CD11c and GFP expression on CD3B220 propidium iodide–negative (PI) cells in the pancreatic and inguinal lymph nodes of MIP.GFP mice (Tg+) and nontransgenic littermates (Tg). (b) Phenotypic analysis of GFP+ cells in the pancreatic lymph nodes of MIP.GFP mice. Dot plots show CD8α, CD11b and GFP expression on CD3B220PICD11c+ cells. Results in a,b are representative of 19 MIP.GFP mice and 5 nontransgenic littermates. (c) Time-lapse images of GFP+ DCs (yellowish green) and CMTMR-labeled BDC2.5 CD4+CD25 TH cells (red) in the pancreatic lymph nodes of a NOD.MIP.GFP mouse 24 h after cell injection (time is in minutes:seconds). Each image in the sequence is generated by the projection of ten images spanning 20 μm in the ‘z’ direction 168–188 μm beneath the lymph node surface. White arrowheads indicate a BDC2.5 CD4+CD25 TH cell migrating along a thin dendrite of a GFP+ DC, ending by aggregating with other CD4+CD25 TH cells near the DC cell body at the 4-minute time point.
Figure 8
Figure 8
BDC2.5 Treg cells stably interact with islet antigen–bearing DCs. (a,b) Movement dynamics of BDC2.5 Treg cells in the pancreatic lymph nodes of NOD mice (a) and NOD.Cd28−/− mice (b), monitored as described for CD4+CD25 TH cells in Figure 2. (c) Time-lapse images of CMTMR-labeled BDC2.5 Treg cells (red) swarming around GFP+ DCs (yellowish green) in the pancreatic lymph nodes of NOD.MIP.GFP mice 24 h after cell injection (time is in minutes:seconds). Each image in the sequence is generated by the projection of eight images spanning 24 μm in the ‘z’ direction 155–180 μm beneath the surface of the lymph node. Data are representative of three or more experiments.

Comment in

References

    1. Sakaguchi S. Naturally arising Foxp3-expressing CD25+CD4+ regulatory T cells in immunological tolerance to self and non-self. Nat Immunol. 2005;6:345–352. - PubMed
    1. Chatenoud L, Salomon B, Bluestone JA. Suppressor T cells–they're back and critical for regulation of autoimmunity! Immunol Rev. 2001;182:149–163. - PubMed
    1. Wood KJ, Sakaguchi S. Regulatory T cells in transplantation tolerance. Nat Rev Immunol. 2003;3:199–210. - PubMed
    1. Singh B, et al. Control of intestinal inflammation by regulatory T cells. Immunol Rev. 2001;182:190–200. - PubMed
    1. Curotto de Lafaille MA, Lafaille JJ. CD4+ regulatory T cells in autoimmunity and allergy. Curr Opin Immunol. 2002;14:771–778. - PubMed

Publication types

MeSH terms