. 2005 Dec;280(1-2):35-45.
doi: 10.1007/s11010-005-8050-5.

Agonist-induced phosphorylation and desensitization of the P2Y2 nucleotide receptor

Affiliations

Agonist-induced phosphorylation and desensitization of the P2Y2 nucleotide receptor

Rosa V Flores et al. Mol Cell Biochem. 2005 Dec.

Abstract

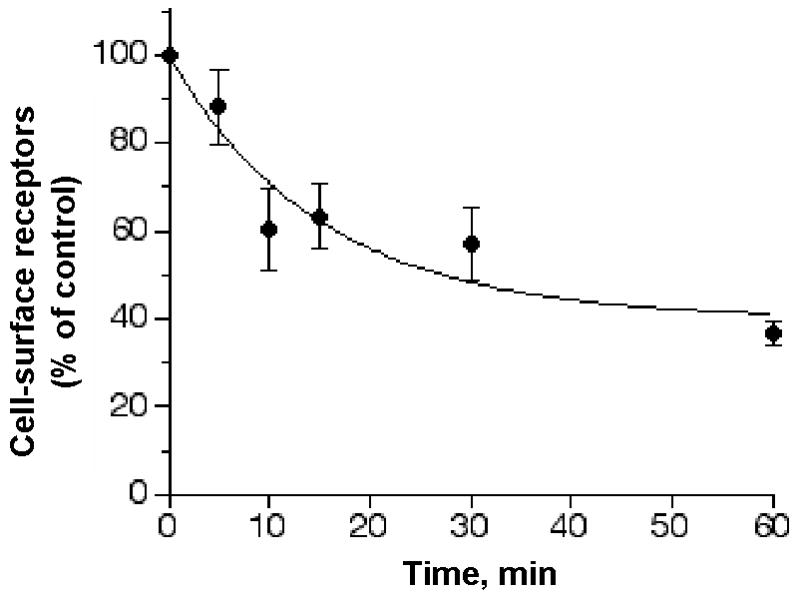
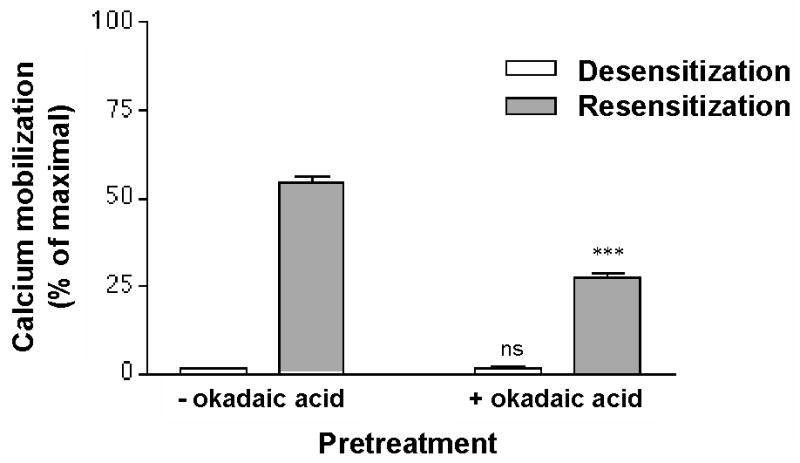
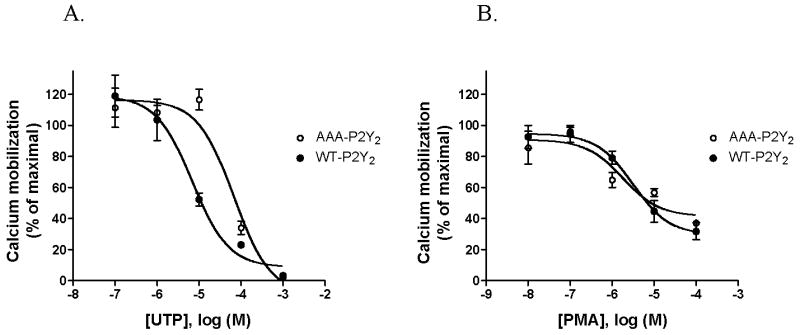
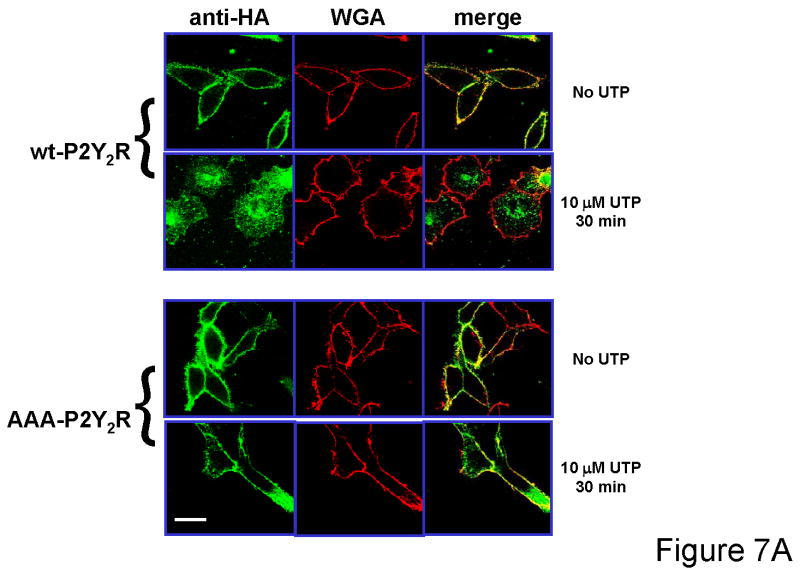
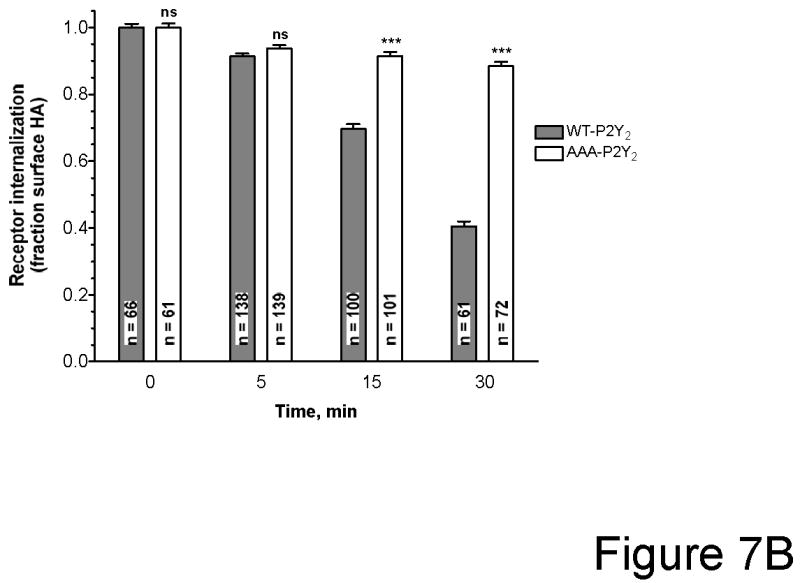
Purification of HA-tagged P2Y2 receptors from transfected human 1321N1 astrocytoma cells yielded a protein with a molecular size determined by SDS-PAGE to be in the range of 57-76 kDa, which is typical of membrane glycoproteins with heterogeneous complex glycosylation. The protein phosphatase inhibitor, okadaic acid, attenuated the recovery of receptor activity from the agonist-induced desensitized state, suggesting a role for P2Y2 receptor phosphorylation in desensitization. Isolation of HA-tagged P2Y2 nucleotide receptors from metabolically [32P]-labelled cells indicated a (3.8 +/- 0.2)-fold increase in the [32P]-content of the receptor after 15 min of treatment with 100 microM UTP, as compared to immunoprecipitated receptors from untreated control cells. Receptor sequestration studies indicated that approximately 40% of the surface receptors were internalized after a 15-min stimulation with 100 microM UTP. Point mutation of three potential GRK and PKC phosphorylation sites in the third intracellular loop and C-terminal tail of the P2Y2 receptor (namely, S243A, T344A, and S356A) extinguished agonist-induced receptor phosphorylation, caused a marked reduction in the efficacy of UTP to desensitize P2Y2 receptor signalling to intracellular calcium mobilization, and impaired agonist-induced receptor internalization. Activation of PKC isoforms with phorbol 12-myristate 13-acetate that caused heterologous receptor desensitization did not increase the level of P2Y2 receptor phosphorylation. Our results indicate a role for receptor phosphorylation by phorbol-insensitive protein kinases in agonist-induced desensitization of the P2Y2 nucleotide receptor.


Figures

Figure 1
Figure 1. Immunoprecipitation of the HA-tagged P2Y2 receptor
1321N1 cells stably transfected with HA-tagged P2Y2 receptor or with pLXSN vector without receptor were detergent solubilized and immunoprecipitated with 12CA5 anti-HA monoclonal antibody. Immunoprecipitated products were resolved on 10% SDS-PAGE, transferred to nitrocellulose and immunoblotted using 3F10 anti-HA-peroxidase monoclonal antibody. Samples in the blot are: protein standards (lanes 1 and 5), immunoprecipitation from HA- tagged P2Y2 transfected cells (lane 2), immunoprecipitation from pLXSN vector transfected cells (lane 3), products eluted from the anti-HA crosslinked gel matrix (lane 4), and 12CA5 anti-HA antibody only (used for immunoprecipitation reactions) (lane 6). Results shown are representative of three separate experiments.
Figure 2
Figure 2. UTP-induced sequestration of P2Y2 receptors expressed in 1321N1 cells
1321N1 cells expressing HA-tagged P2Y2 receptors were incubated at 37°C with 100 μM UTP for the indicated times. Control cells were incubated without UTP to determine the total detectable cell-surface P2Y2 receptors. The cells were washed in assay buffer and incubated with fluorescein isothiocyanate (FITC)-labeled goat anti-mouse antibody at 4°C in the dark for 1 h. Cells were washed again and analyzed by flow cytometry as described in Experimental Procedures. Each value shown is expressed as a percentage of the total P2Y2 receptors detected in control cells that were treated with UTP-free carrier buffer. The data presented are the average ± SEM of results from three independent experiments.
Figure 3
Figure 3. Effect of the phosphatase inhibitor okadaic acid on recovery of P2Y2 receptor from UTP-induced desensitization
Fura2 labeled P2Y2-1321N1 cells were incubated with 100 μM UTP for 15 min at 37°C in the presence of 1 μM okadaic acid. The cells were washed, resuspended in buffer and either assayed immediately for Ca2+ mobilization (open bars), or incubated for 30 min in UTP-free medium (shaded bars), in the presence or absence of 1 μM okadaic acid prior to measuring changes in [Ca2+]i in response to 1 μM UTP as described in Experimental Procedures. Data are expressed as a percentage of the maximal response to 100 μM UTP in control untreated cells. Data are the average ± SEM of results from three independent experiments. Cells with okadaic acid treatment were compared to parallel cultures without okadaic acid treatment (*** p<0.001; ns, p>0.05 one-way ANOVA).
Figure 4
Figure 4. UTP-induced phosphorylation of P2Y2 receptors
1321N1 cells expressing the HA-tagged P2Y2 receptor gene were metabolically labeled with [32P]-orthophosphate for 2 h in serum-free and phosphate-free medium and then challenged with 100 μM UTP for 15 min as described in Experimental Procedures. Control-unstimulated cells were challenged with carrier medium. Cells were lysed and detergent-solubilized cell extracts were analyzed by anti-HA immunoprecipitation, SDS-PAGE (10%), and Western blot. The [32P]-radioactivity data were acquired prior to chemiluminescence analysis by exposing the nitrocellulose membrane to the Molecular Imager Screen-BI for 18 h. Total protein in the membrane was then analyzed after chemiluminescence detection by incubating the same nitrocellulose membrane with peroxidase-conjugated anti-HA antibody followed by luminol substrate incubation and exposure to the Molecular Imager Screen-CHEMI for 15 min. (A) Chemiluminescence (left panel) and [32P]-radioactivity (right panel) signals were detected in the same nitrocellulose membrane. Molecular weight standards are indicated on the left. (B) Chemiluminescence and [32P]-radioactivity counts (arbitrary units) were detected in the nitrocellulose membrane (thick line, UTP-treated cells; thin line, control unstimulated cells) and are expressed as a function of protein migration distance (in mm) from top to bottom of the scanned membrane. [32P]-radioactivity counts from phosphorylated proteins were normalized by calculating the ratio to chemiluminescence counts from total immunoprecipitated protein. UTP treatment caused a 3.8 ± 0.2-fold increase in phosphorylation as compared to control unstimulated cells. Results shown are representative of three separate experiments.
Figure 5
Figure 5. Desensitization of wild type and AAA-P2Y2 receptors mediated by UTP and PMA
Potential serine/threonine phosphorylation sites for GRK and PKC in the receptor (S243, T344, S356) were mutated to alanine to create the AAA-P2Y2 receptor. 1321N1 cells expressing either wild type (WT,•) or AAA-P2Y2 (○) receptor were labeled with fura2 and incubated for 15 min with various concentrations of either UTP (A) or phorbol 12-myristate 13-acetate (PMA) (B). Ca2+ mobilization was determined after rechallenging the cells with the EC50 concentration for UTP of each transfected cell (wild type EC50 = 0.32 μM and AAA-P2Y2 mutant EC50 = 0.20 μM). The data are expressed as a percentage of the maximal response to 100 μM UTP in cells that were not preincubated with UTP or PMA. Values shown are the mean ± SEM of three separate experiments.
Figure 6
Figure 6. Phosphorylation of wild type and AAA-P2Y2 receptors mediated by UTP and PMA
1321N1 cells expressing either wild type or AAA-P2Y2 receptor were labeled with [32P]-orthophosphate for two hours in serum-free and phosphate-free medium. Cells were challenged for 15 min with 100 μM UTP or 10 μM phorbol 12-myristate 13-acetate (PMA). Control unstimulated cells were treated with carrier medium. Detergent solubilized cell extracts were immunoprecipitated with anti-HA antibody followed by SDS-PAGE (10%) and Western blot as described in Methods. [32P]-radioactivity counts from phosphorylated proteins were normalized by calculating the ratio to chemiluminescence counts from total immunoprecipitated protein as described in Figure 6. Results are the mean ± SEM of three separate experiments (**p<0.01, significantly different from unstimulated control).
Figure 7
Figure 7. Internalization of wild type P2Y2 and AAA-P2Y2 receptors transfected in 1321N1 cells
(A) 1321N1 cells expressing either HA-tagged wild type or AAA-P2Y2 receptors were treated with or without 10 μM UTP for 30 min as described in Experimental Procedures. Laser scanning confocal microscopy images were acquired as described in Experimental Procedures. The HA-tagged receptors were detected by immunoflurescence with Alexa Fluor 488 staining (shown in green) and cell surface N-acetylglucosamine and N-acetylneuraminic acid residues in the same cells were detected with Texas Red-conjugated wheat germ agglutinin (WGA) (shown in red). Merge images are shown. Scale bar in lower left corner = 20 μm. (B) The weighted colocalization coefficient of the HA-tagged P2Y2 receptors with WGA were determined as described in Experimental Procedures. Receptor internalization (fraction surface HA-tagged) was determined at the indicated times after treatment with 10 μM UTP. The surface HA-tagged receptors were calculated from the ratio of WCC values to WCC in unstimulated control cells. Data presented are the average ± SEM of n individual cells (as indicted inside each bar) determined from at least three independent experiments. Cells expressing wild type P2Y2 receptors were compared to cells expressing AAA-P2Y2 receptors (*** p<0.001; ns, p>0.05 one-way ANOVA).

Similar articles

Cited by

References

    1. Hanley PJ, Musset B, Renigunta V, Limberg SH, Dalpke AH, Sus R, Heeg KM, Preisig-Muller R, Daut J. Extracellular ATP induces oscillations of intracellular Ca2+ and membrane potential and promotes transcription of IL-6 in macrophages. Proc Natl Acad Sci U S A. 2004;101:9479–9484. - PMC - PubMed
    1. Kannan S. Neutrophil chemotaxis: potential role of chemokine receptors in extracellular nucleotide induced Mac-1 expression. Med Hypotheses. 2003;61:577–579. - PubMed
    1. Neary JT, Baker L, Jorgensen SL, Norenberg MD. Extracellular ATP induces stellation and increases glial fibrillary acidic protein content and DNA synthesis in primary astrocyte cultures. Acta Neuropathol (Berl) 1994;87:8–13. - PubMed
    1. Chorna NE, Santiago-Perez LI, Erb L, Seye CI, Neary JT, Sun GY, Weisman GA, Gonzalez FA. P2Y receptors activate neuroprotective mechanisms in astrocytic cells. J Neurochem. 2004;91:119–132. - PubMed
    1. Stutts MJ, Chinet TC, Mason SJ, Fullton JM, Clarke LL, Boucher RC. Regulation of Cl-channels in normal and cystic fibrosis airway epithelial cells by extracellular ATP. Proc Natl Acad Sci U S A. 1992;89:1621–1625. - PMC - PubMed

Publication types

LinkOut - more resources