Comparative Study
. 2005 Nov 27;33(21):e182.
doi: 10.1093/nar/gni181.

Faster quantitative real-time PCR protocols may lose sensitivity and show increased variability

Affiliations
Comparative Study

Faster quantitative real-time PCR protocols may lose sensitivity and show increased variability

Chelsey Hilscher et al. Nucleic Acids Res. .

Abstract

Quantitative real-time PCR has become the method of choice for measuring mRNA transcription. Recently, fast PCR protocols have been developed as a means to increase assay throughput. Yet it is unclear whether more rapid cycling conditions preserve the original assay performance characteristics. We compared 16 primer sets directed against Epstein-Barr virus (EBV) mRNAs using universal and fast PCR cycling conditions. These primers are of clinical relevance, since they can be used to monitor viral oncogene and drug-resistance gene expression in transplant patients and EBV-associated cancers. While none of the primers failed under fast PCR conditions, the fast PCR protocols performed worse than universal cycling conditions. Fast PCR was associated with a loss of sensitivity as well as higher variability, but not with a loss of specificity or with a higher false positive rate.


Figures
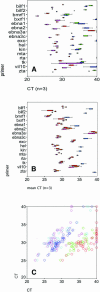
Figure 1
Figure 1
(A) CT values across n = 16 primer pairs for different QPCR conditions: universal (red), Afast (green), Mfast (blue) and Sfast at 60°C (purple) (B) CT values across n = 16 primer pairs for different QPCR conditions: universal repeat #1, universal repeat #2, universal repeat #3 (all shades of red) and Afast (blue). The box represents the interquartile range, whiskers indicate the highest and lowest values, excluding outliers for triplicate measurements. A line across the box indicates the median. (C) Correlation of mean CT values for the indicated QPCR conditions relative to universal repeat #2 on the vertical axis: red, Afast; green, Mfast; blue, universal repeat #2; purple, Sfast at 60°C; light blue, Sfast at 62°C.
Figure 2
Figure 2
Variation based on pipetting and instrument error. Depicted is a histogram for the CT values obtained from n = 64 replicates. The vertical axis shows the number of wells and the horizontal axis the CT values. The calculated normal distribution is overlaid in black.
Figure 3
Figure 3
(A) SD across n = 16 primer pairs for each of the different QPCR conditions. (B) SD across n = 7 QPCR conditions for each of the 16 primer pairs. The box represents the interquartile range, whiskers indicate the highest and lowest values, excluding outliers. Asterisks indicate outliers. A line across the box indicates the median.
Figure 4
Figure 4
The vertical axis shows CT values for n = 85 primers using a total cellular DNA as template. The horizontal axis plots each primer as the percentile of the primer set that was rank-ordered based upon CT under universal cycling conditions. Blue squares show the result under universal cycling conditions at 60°C, green circles under Sfast at 62°C, red triangles under Mfast at 60°C and black rhombi under Afast conditions at 60°C.
Figure 5
Figure 5
(A) Amplification dependence on amplification efficiency K. The X-axis shows cycle number CT, the Y-axis amplification efficiency K and the Z-axis the number of molecules starting from N0 = 1. (B) Fold difference = 2dCTKdCT shows the fold error (Z-axis) introduces by change in amplification efficiency K (Y-axis) for given dCT differences (X-axis).

References

    1. Jebbink J., Bai X., Rogers B.B., Dawson D.B., Scheuermann R.H., Domiati-Saad R. Development of real-time PCR assays for the quantitative detection of Epstein–Barr virus and cytomegalovirus, comparison of TaqMan probes, and molecular beacons. J. Mol. Diagn. 2003;5:15–20. - PMC - PubMed
    1. Dittmer D.P. Transcription profile of Kaposi's sarcoma-associated herpesvirus in primary Kaposi's sarcoma lesions as determined by real-time PCR arrays. Cancer Res. 2003;63:2010–2015. - PubMed
    1. Vandesompele J., De Preter K., Pattyn F., Poppe B., Van Roy N., De Paepe A., Speleman F. Accurate normalization of real-time quantitative RT–PCR data by geometric averaging of multiple internal control genes. Genome Biol. 2002;3 RESEARCH0034. - PMC - PubMed
    1. Pfaffl M.W., Horgan G.W., Dempfle L. Relative expression software tool (REST) for group-wise comparison and statistical analysis of relative expression results in real-time PCR. Nucleic Acids Res. 2002;30:e36. - PMC - PubMed
    1. Mackay I.M., Arden K.E., Nitsche A. Real-time PCR in virology. Nucleic Acids Res. 2002;30:1292–1305. - PMC - PubMed

Publication types

MeSH terms