. 2005 Dec 5;202(11):1517-26.
doi: 10.1084/jem.20051625. Epub 2005 Nov 28.

Structural basis for CD1d presentation of a sulfatide derived from myelin and its implications for autoimmunity

Affiliations

Structural basis for CD1d presentation of a sulfatide derived from myelin and its implications for autoimmunity

Dirk M Zajonc et al. J Exp Med. .

Abstract

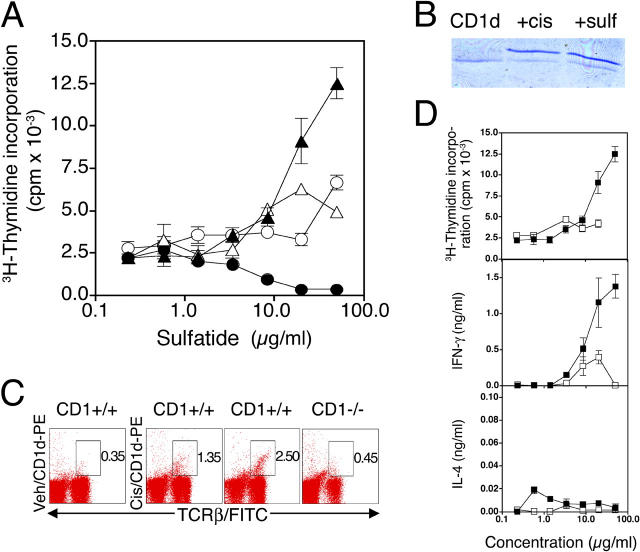
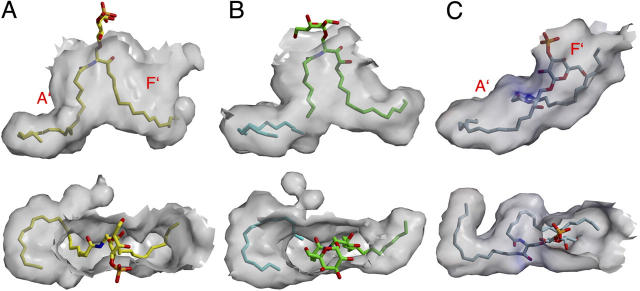
Sulfatide derived from the myelin stimulates a distinct population of CD1d-restricted natural killer T (NKT) cells. Cis-tetracosenoyl sulfatide is one of the immunodominant species in myelin as identified by proliferation, cytokine secretion, and CD1d tetramer staining. The crystal structure of mouse CD1d in complex with cis-tetracosenoyl sulfatide at 1.9 A resolution reveals that the longer cis-tetracosenoyl fatty acid chain fully occupies the A' pocket of the CD1d binding groove, whereas the sphingosine chain fills up the F' pocket. A precise hydrogen bond network in the center of the binding groove orients and positions the ceramide backbone for insertion of the lipid tails in their respective pockets. The 3'-sulfated galactose headgroup is highly exposed for presentation to the T cell receptor and projects up and away from the binding pocket due to its beta linkage, compared with the more intimate binding of the alpha-glactosyl ceramide headgroup to CD1d. These structure and binding data on sulfatide presentation by CD1d have important implications for the design of therapeutics that target T cells reactive for myelin glycolipids in autoimmune diseases of the central nervous system.


Figures

Figure 1.
Figure 1.
CD1d loading and T cell recognition of sulfatide. (A) Dominant response to cis-tetracosenoyl sulfatide as examined by in vitro proliferation to a titrated dose of cis-tetracosenoyl (C24:1) sulfatide (▴), tetracosanoyl (C24:0) sulfatide (▵), lyso-sulfatide (no fatty acid; •), and palmitoyl (C16:0) sulfatide (○) in splenocytes from C57BL/6 mice. One of three representative experiments is shown. (B) Loading of cis-tetracosenoyl sulfatide onto mouse CD1d molecules. 9 μg of purified mouse CD1d protein was incubated at 37°C for 6 h with 4 μg of purified sulfatide (sulf) from bovine brain or synthetic cis-tetracosenoyl sulfatide (cis) and subjected to IEF gel electrophoresis. One of two representative experiments is shown. (C) Staining of mononuclear cells from liver with cis-tetracosenoyl sulfatide CD1d/tetramer. Flow cytometric analysis of liver mononuclear cells from CD1d+/+ (C57BL/6, panels 1 and 2, or SJL/J, panel 3) and C57BL/6.CD1d−/− mice (panel 4) after staining with either cis-tetracosenoyl sulfatide loaded or unloaded CD1d tetramers, which were labeled with phycoerythrin (PE) and anti–TCR-β–FITC. In each panel, the numbers indicate the percent of positive cells. One of three representative experiments is shown. (D) Proliferation and cytokine secretion response of splenocytes from naive C57BL/6 (▪) or C57BL/6.CD1d−/− (□) mice to an in vitro stimulation with a titrated dose of cis-tetracosenoyl sulfatide. One of five representative experiments is shown.
Figure 2.
Figure 2.
Overview of the CD1d–sulfatide structure. (A) Schematic representation (front view) of the CD1d (α1–α3 domains)-β2M heterodimer (gray) with β-strands and α-helices highlighted and with bound cis-tetracosenoyl sulfatide ligand in stick representation (yellow). N-linked carbohydrates are depicted as gray stick models. Atom colors for all structural representations are as follows: yellow/gray, carbon; red, oxygen; blue, nitrogen; orange, sulfate. (B) Top view looking into the CD1d-binding groove. The sulfatide fatty acid is bound in the larger A′ pocket, and the sphingosine backbone is bound in the F′ pocket. N20, N42, and N165 represent the three ordered N-linked glycosylation sites that carry at least the remaining proximal N-acetylglucosamine residue after deglycosylation. (C) The chemical structure of the sulfatide used in this study and other CD1d ligands, such as PC (6), iGB3 (20), and the short-chain α-GalCer variant PBS-25 (11) for structural comparison. The length of the individual alkyl chains is given as the number of carbon atoms (C12–C26).
Figure 3.
Figure 3.
Conformation of the sulfatide in the CD1d-binding groove. After refinement, a 2Fo-Fc electron density map was calculated and contoured at 1σ as a blue mesh around the ligand (yellow). Several important contact residues that are involved in ligand binding are depicted and labeled. (A) Side view, after removing the α2-helix for clarity. (B) View looking down into the CD1d-binding groove (TCR view). The sulfogalactosyl headgroup is omitted to highlight the well-defined electron density around the branching point of the lipid backbone, which we propose acts as a constraint to orient the different alkyl chains into their specific binding pockets.
Figure 4.
Figure 4.
Stereo view of the hydrogen–bond network between sulfatide and CD1d. The sulfatide ligand bound in the CD1d-binding groove is shown in a rear view from the COOH-terminal end of the α1-helix. Hydrogen bonds between the protein and the ligand residues are depicted as blue dashed lines and range in distance from 2.5Å to 3.5Å. The α1-helix residues Arg79 (R79), Asp80 (D80), and Met69 (M69) mainly bind the lipid backbone, whereas Asp153 (D153), Thr156 (T156), and Gln154 (Q154) of the α2-helix interact more closely with the galactose headgroup.
Figure 5.
Figure 5.
Comparative binding analysis of different CD1d ligands. The CD1d binding pocket is shown as a transparent molecular surface in a side view (top) or top view (bottom), either with (A) bound cis-teracosenoyl sulfatide (C24:1) or with (B) the short-chain α-GalCer variant PBS-25 (PDB code 1Z5L). Although the galactose of sulfatide presented by CD1d is more exposed and sticks out from the center of the groove, that of PBS-25 sits more closely above the CD1d surface while burying the lipid backbone underneath. (C) The stearoyl sulfatide (C18:0) ligand is more nestled in the CD1a-binding groove (PDB code 1ONQ), whereas the fatty acid tail end is exposed at the CD1 surface.

References

    1. Bendelac, A. 1995. Mouse NK1+ T cells. Curr. Opin. Immunol. 7:367–374. - PubMed
    1. Godfrey, D.I., and M. Kronenberg. 2004. Going both ways: immune regulation via CD1d-dependent NKT cells. J. Clin. Invest. 114:1379–1388. - PMC - PubMed
    1. Wilson, S.B., and T.L. Delovitch. 2003. Janus-like role of regulatory iNKT cells in autoimmune disease and tumour immunity. Nat. Rev. Immunol. 3:211–222. - PubMed
    1. Kawano, T., J. Cui, Y. Koezuka, I. Toura, Y. Kaneko, K. Motoki, H. Ueno, R. Nakagawa, H. Sato, E. Kondo, et al. 1997. CD1d-restricted and TCR-mediated activation of vα14 NKT cells by glycosylceramides. Science. 278:1626–1629. - PubMed
    1. Zeng, Z., A.R. Castano, B.W. Segelke, E.A. Stura, P.A. Peterson, and I.A. Wilson. 1997. Crystal structure of mouse CD1: an MHC-like fold with a large hydrophobic binding groove. Science. 277:339–345. - PubMed

Publication types

MeSH terms