

Assessing the spatiotemporal evolution of neuronal activation with single-trial event-related potentials and functional MRI
- PMID: 16314575
- PMCID: PMC1295592
- DOI: 10.1073/pnas.0505508102
Assessing the spatiotemporal evolution of neuronal activation with single-trial event-related potentials and functional MRI
Abstract
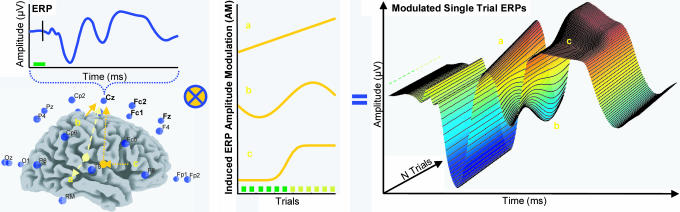
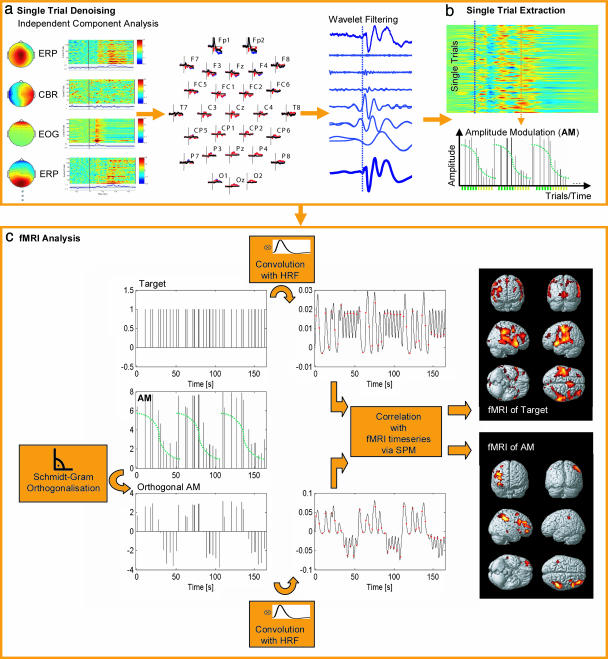
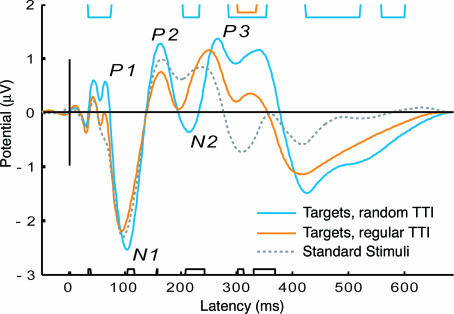
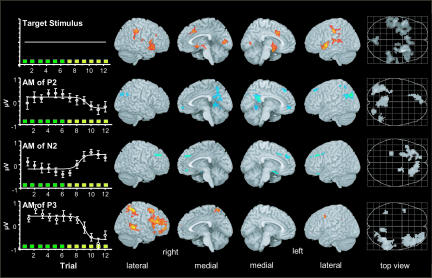
The brain acts as an integrated information processing system, which methods in cognitive neuroscience have so far depicted in a fragmented fashion. Here, we propose a simple and robust way to integrate functional MRI (fMRI) with single trial event-related potentials (ERP) to provide a more complete spatiotemporal characterization of evoked responses in the human brain. The idea behind the approach is to find brain regions whose fMRI responses can be predicted by paradigm-induced amplitude modulations of simultaneously acquired single trial ERPs. The method was used to study a variant of a two-stimulus auditory target detection (odd-ball) paradigm that manipulated predictability through alternations of stimulus sequences with random or regular target-to-target intervals. In addition to electrophysiologic and hemodynamic evoked responses to auditory targets per se, single-trial modulations were expressed during the latencies of the P2 (170-ms), N2 (200-ms), and P3 (320-ms) components and predicted spatially separated fMRI activation patterns. These spatiotemporal matches, i.e., the prediction of hemodynamic activation by time-variant information from single trial ERPs, permit inferences about regional responses using fMRI with the temporal resolution provided by electrophysiology.
Figures
Similar articles
-
The effects of immediate and short-term retest on the latencies and amplitudes of the auditory event-related potentials in healthy adults.J Neurosci Methods. 2010 Jan 30;186(1):77-80. doi: 10.1016/j.jneumeth.2009.10.013. Epub 2009 Oct 23. J Neurosci Methods. 2010. PMID: 19854216
-
Spatiotemporal dynamics of single-letter reading: a combined ERP-FMRI study.Arch Ital Biol. 2008 Jun;146(2):83-105. Arch Ital Biol. 2008. PMID: 18822797
-
Single-trial analysis of oddball event-related potentials in simultaneous EEG-fMRI.Hum Brain Mapp. 2007 Jul;28(7):602-13. doi: 10.1002/hbm.20289. Hum Brain Mapp. 2007. PMID: 17295312
-
Some considerations on estimating event-related brain signals.J Neural Transm Gen Sect. 1995;99(1-3):103-29. doi: 10.1007/BF01271473. J Neural Transm Gen Sect. 1995. PMID: 8579799 Review.
-
Response: event-related brain dynamics -- unifying brain electrophysiology.Trends Neurosci. 2002 Aug;25(8):390. doi: 10.1016/s0166-2236(02)02198-7. Trends Neurosci. 2002. PMID: 12127749 Review. No abstract available.
Cited by
-
Altruistic traits are predicted by neural responses to monetary outcomes for self vs charity.Soc Cogn Affect Neurosci. 2016 Jun;11(6):863-76. doi: 10.1093/scan/nsw026. Epub 2016 Mar 29. Soc Cogn Affect Neurosci. 2016. PMID: 27030510 Free PMC article.
-
EEG-Informed fMRI Reveals a Disturbed Gamma-Band-Specific Network in Subjects at High Risk for Psychosis.Schizophr Bull. 2016 Jan;42(1):239-49. doi: 10.1093/schbul/sbv092. Epub 2015 Jul 10. Schizophr Bull. 2016. PMID: 26163477 Free PMC article.
-
Rapid brain responses independently predict gain maximization and loss minimization during economic decision making.J Neurosci. 2013 Apr 17;33(16):7011-9. doi: 10.1523/JNEUROSCI.4242-12.2013. J Neurosci. 2013. PMID: 23595758 Free PMC article.
-
Enhancement of activity of the primary visual cortex during processing of emotional stimuli as measured with event-related functional near-infrared spectroscopy and event-related potentials.Hum Brain Mapp. 2008 Jan;29(1):28-35. doi: 10.1002/hbm.20368. Hum Brain Mapp. 2008. PMID: 17315227 Free PMC article.
-
[Neurovascular coupling analysis of working memory based on electroencephalography and functional near-infrared spectroscopy].Sheng Wu Yi Xue Gong Cheng Xue Za Zhi. 2022 Apr 25;39(2):228-236. doi: 10.7507/1001-5515.202108048. Sheng Wu Yi Xue Gong Cheng Xue Za Zhi. 2022. PMID: 35523543 Free PMC article. Chinese.
References
-
- Dale, A. M. & Halgren, E. (2001) Curr. Opin. Neurobiol. 11, 202-208. - PubMed
-
- Hopfinger, J. B., Khoe, W. & Song, A. W. (2005) in Event Related Potentials, A Methods Handbook., ed. Handy, T. C. (MIT Press, Cambridge, MA), pp. 345-380.
-
- Halgren, E., Marinkovic, K. & Chauvel, P. (1998) Electroencephalogr. Clin. Neurophysiol. 106, 156-164. - PubMed
-
- Halgren, E., Baudena, P., Clarke, J. M., Heit, G., Liegeois, C., Chauvel, P. & Musolino, A. (1995) Electroencephalogr. Clin. Neurophysiol. 94, 191-220. - PubMed
Publication types
MeSH terms
LinkOut - more resources
Full Text Sources
