

An algorithm for the determination and quantification of components of nucleic acid mixtures based on single sequencing reactions
- PMID: 16316462
- PMCID: PMC1318471
- DOI: 10.1186/1471-2105-6-281
An algorithm for the determination and quantification of components of nucleic acid mixtures based on single sequencing reactions
Abstract
Background: Determination and quantification of nucleic acid components in a mixture is usually accomplished by microarray approaches, where the mixtures are hybridized against specific probes. As an alternative, we propose here that a single sequencing reaction from a mixture of nucleic acids holds enough information to potentially distinguish the different components, provided it is known which components can occur in the mixture.
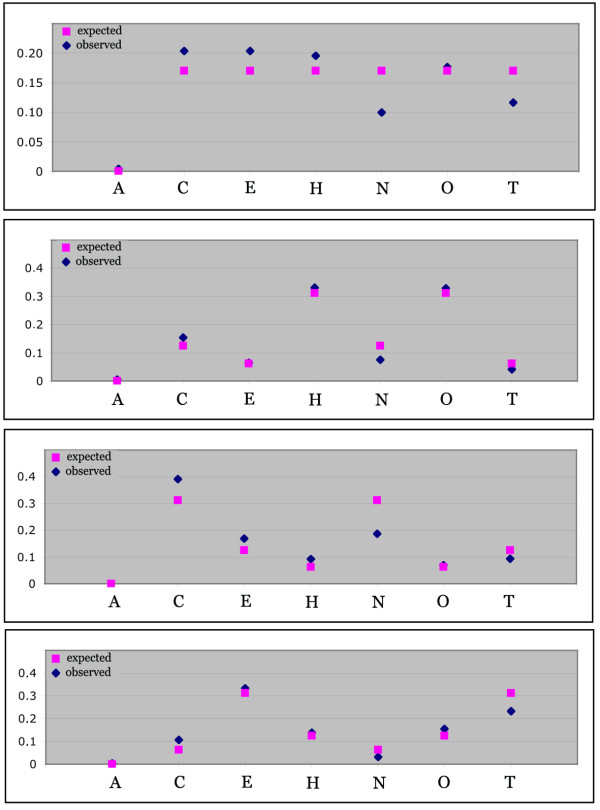
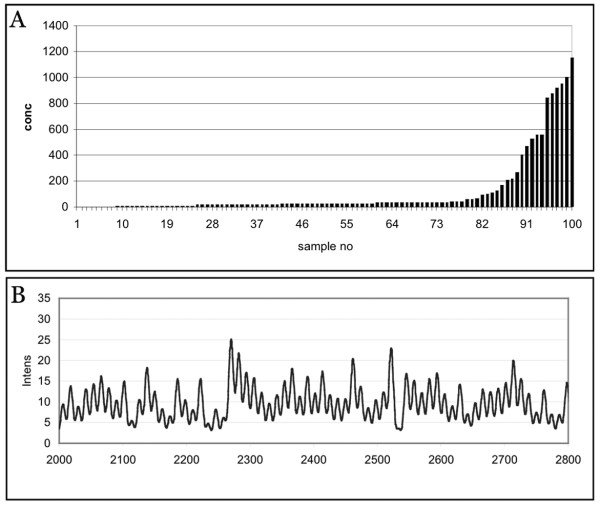
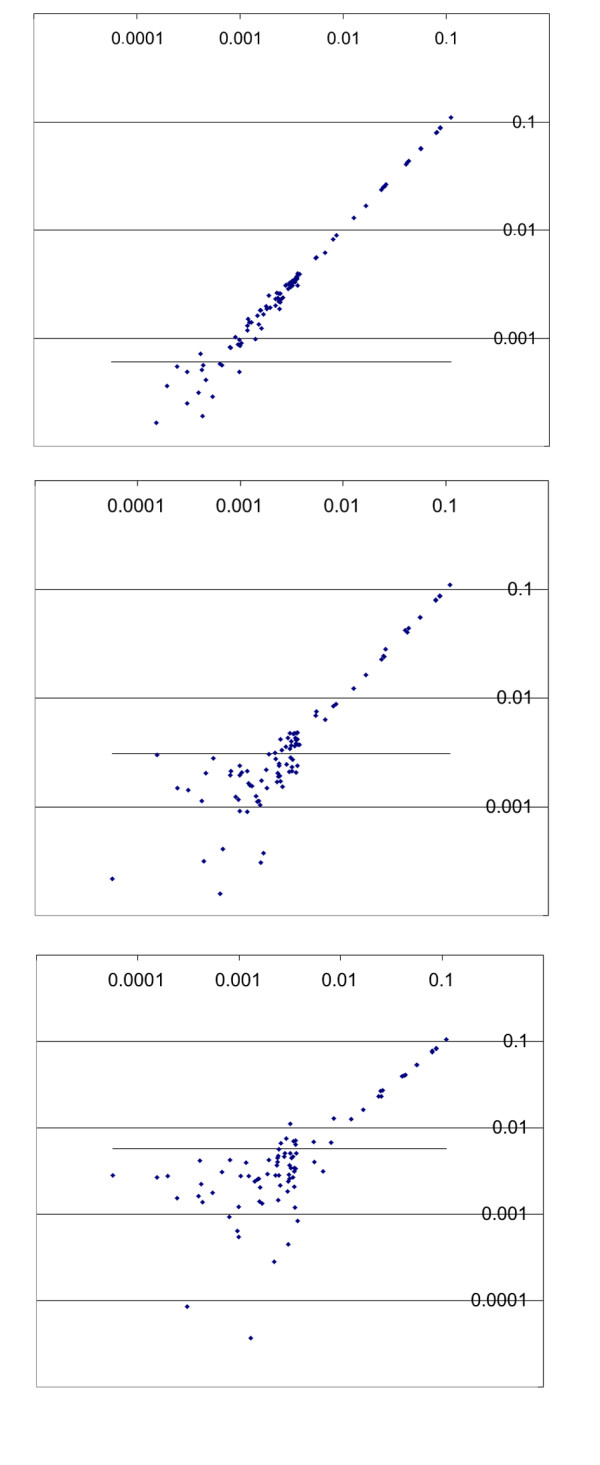
Results: We describe an algorithm that is based on a set of linear equations which can be solved when the sequencing profiles of the individual components are known and when the number of sequenced nucleotides is larger than the number of components in the mixture. We have implemented the procedure for one type of sequencing approach, pyrosequencing, which produces a stepwise output of peaks that is particularly suitable for the procedure. As an example we use signature sequences from ribosomal RNA to distinguish and quantify several different species in a mixture. Using simulations, we show that the procedure may also be applicable for dideoxy sequencing on capillary sequencers, requiring only some instrument specific adaptations of protocols and software.
Conclusion: The parallel sequencing approach described here may become a simple and cheap alternative to microarray experiments which aim at routine re-determination and quantification of known nucleic acid components from environmental samples or tissue samples.
Figures

Similar articles
-
Individual sequences in large sets of gene sequences may be distinguished efficiently by combinations of shared sub-sequences.BMC Bioinformatics. 2005 Apr 8;6:90. doi: 10.1186/1471-2105-6-90. BMC Bioinformatics. 2005. PMID: 15817134 Free PMC article.
-
In silico microdissection of microarray data from heterogeneous cell populations.BMC Bioinformatics. 2005 Mar 14;6:54. doi: 10.1186/1471-2105-6-54. BMC Bioinformatics. 2005. PMID: 15766384 Free PMC article.
-
A generic approach for the design of whole-genome oligoarrays, validated for genomotyping, deletion mapping and gene expression analysis on Staphylococcus aureus.BMC Genomics. 2005 Jun 17;6:95. doi: 10.1186/1471-2164-6-95. BMC Genomics. 2005. PMID: 15963225 Free PMC article.
-
Sequencing by hybridization (SBH): advantages, achievements, and opportunities.Adv Biochem Eng Biotechnol. 2002;77:75-101. doi: 10.1007/3-540-45713-5_5. Adv Biochem Eng Biotechnol. 2002. PMID: 12227738 Review.
-
Overview of DNA sequencing strategies.Curr Protoc Mol Biol. 2008 Jan;Chapter 7:Unit 7.1. doi: 10.1002/0471142727.mb0701s81. Curr Protoc Mol Biol. 2008. PMID: 18231983 Review.
Cited by
-
Base-calling algorithm with vocabulary (BCV) method for analyzing population sequencing chromatograms.PLoS One. 2013;8(1):e54835. doi: 10.1371/journal.pone.0054835. Epub 2013 Jan 28. PLoS One. 2013. PMID: 23382983 Free PMC article.
References
-
- Tautz D, Arctander P, Minelli A, Thomas RH, Vogler AP. A plea for DNA taxonomy. Trends in Ecol Evol. 2003;18:70–74. doi: 10.1016/S0169-5347(02)00041-1. - DOI
Publication types
MeSH terms
Substances
LinkOut - more resources
Full Text Sources
Research Materials
