Comparative Study
. 2006 Feb 14;24(3):276-89.
doi: 10.1152/physiolgenomics.00109.2005. Epub 2005 Nov 29.

Divergence between motoneurons: gene expression profiling provides a molecular characterization of functionally discrete somatic and autonomic motoneurons

Affiliations
Comparative Study

Divergence between motoneurons: gene expression profiling provides a molecular characterization of functionally discrete somatic and autonomic motoneurons

Dapeng Cui et al. Physiol Genomics. .

Abstract

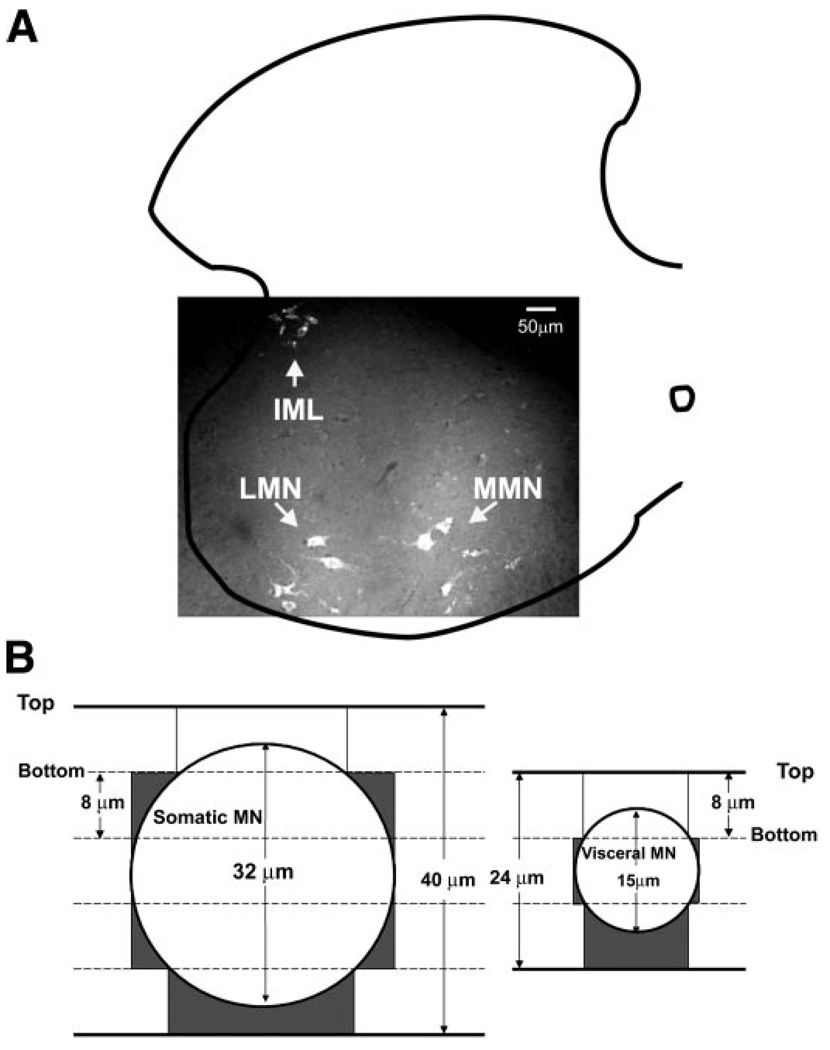
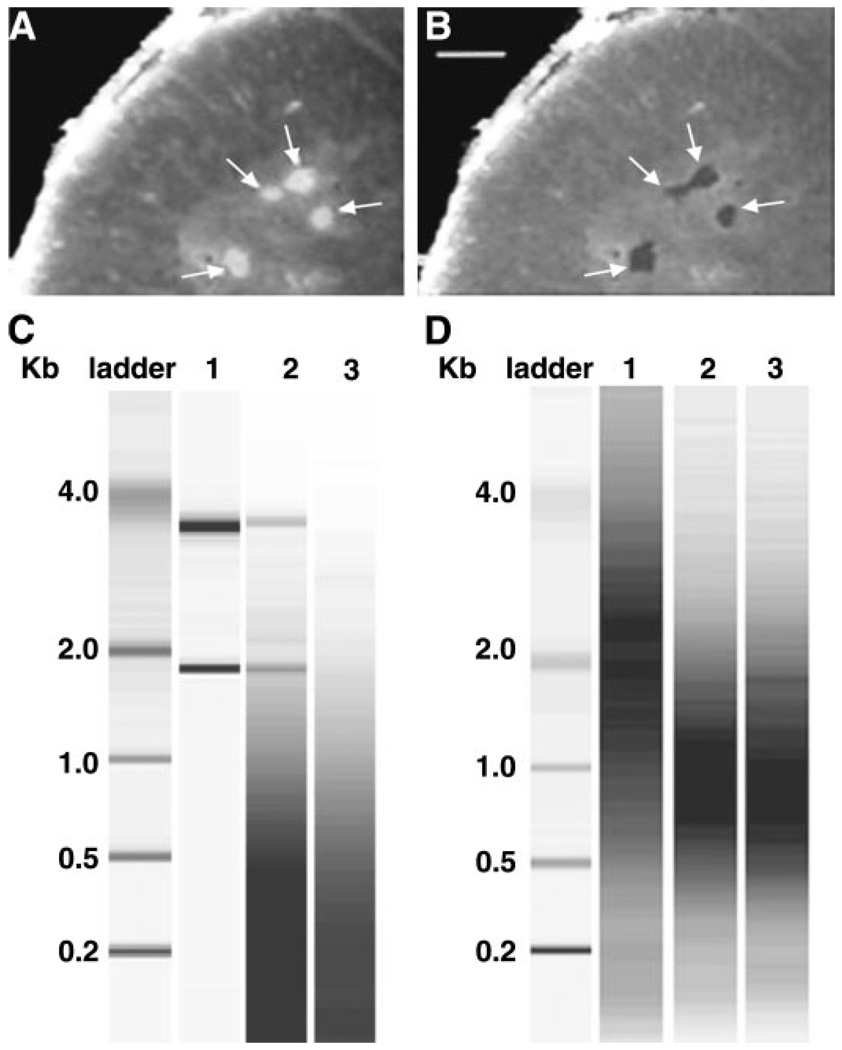
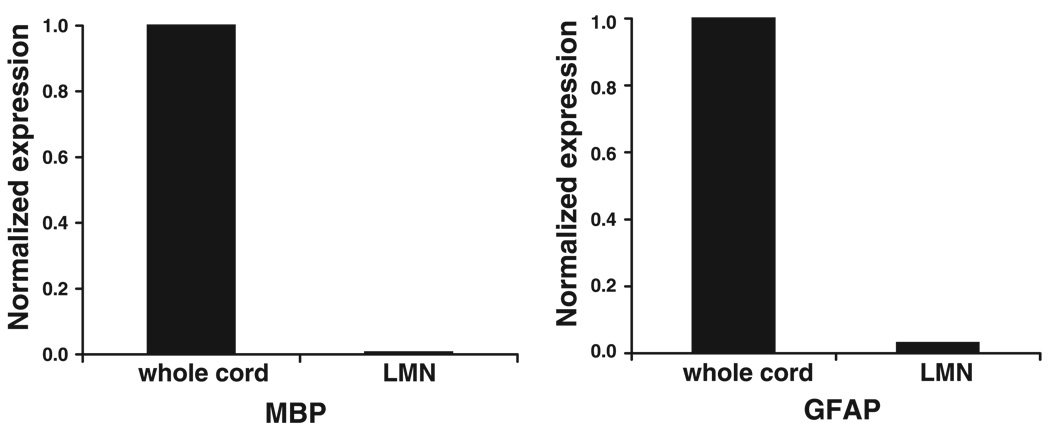
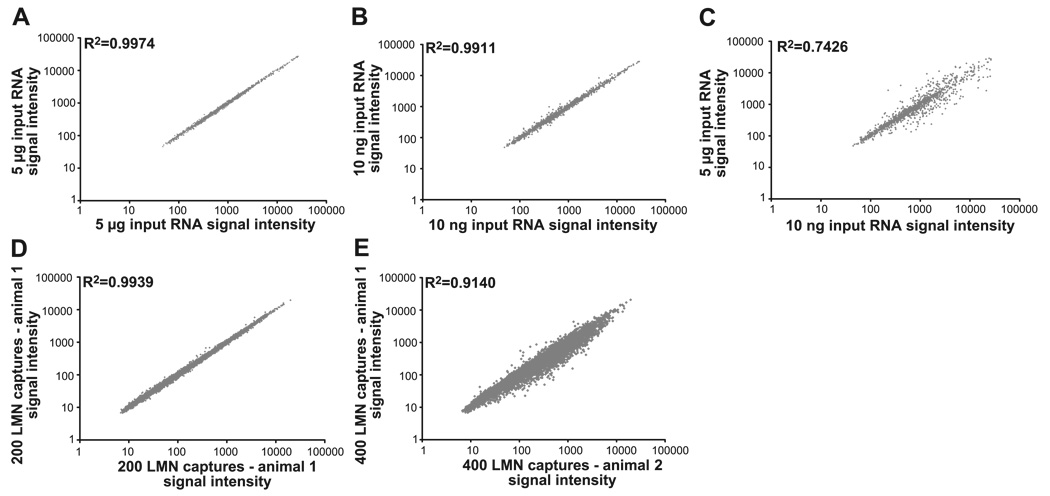
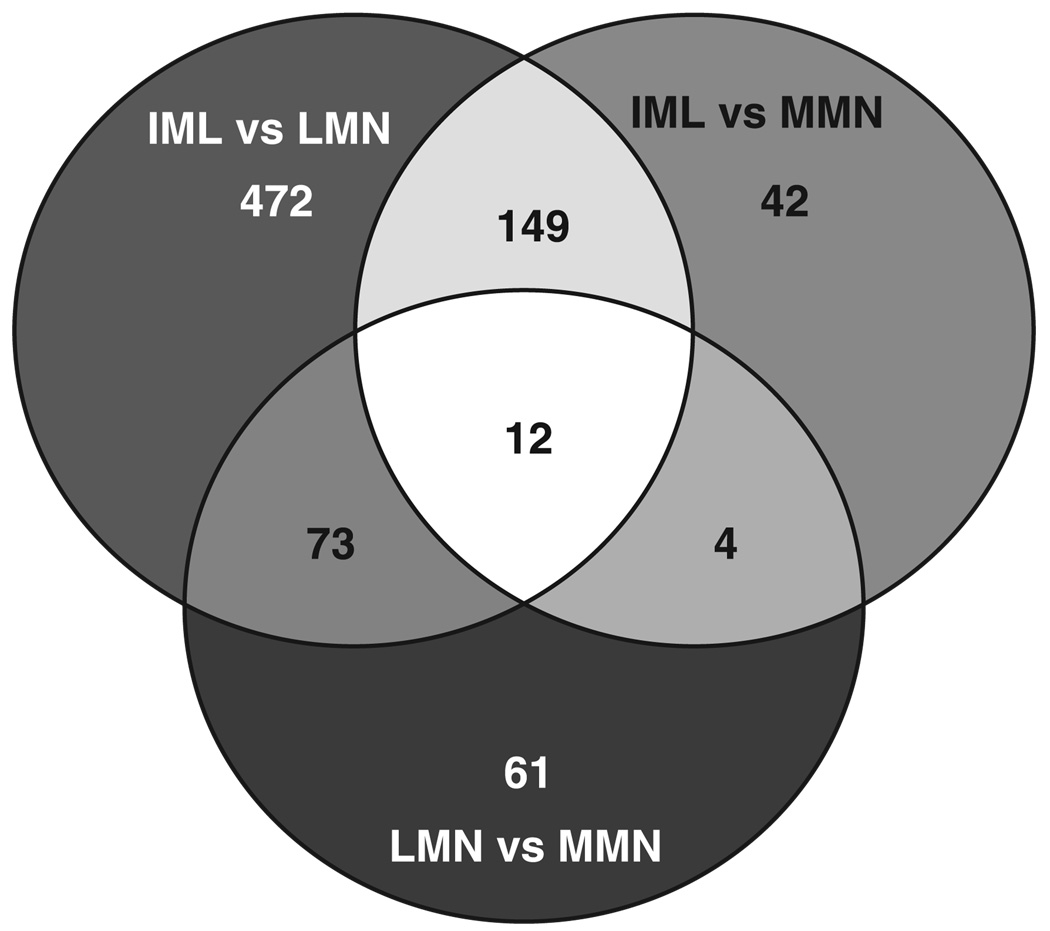
Studies in the developing spinal cord suggest that different motoneuron (MN) cell types express very different genetic programs, but the degree to which adult programs differ is unknown. To compare genetic programs between adult MN columnar cell types, we used laser capture microdissection (LCM) and Affymetrix microarrays to create expression profiles for three columnar cell types: lateral and medial MNs from lumbar segments and sympathetic preganglionic motoneurons located in the thoracic intermediolateral nucleus. A comparison of the three expression profiles indicated that approximately 7% (813/11,552) of the genes showed significant differences in their expression levels. The largest differences were observed between sympathetic preganglionic MNs and the lateral motor column, with 6% (706/11,552) of the genes being differentially expressed. Significant differences in expression were observed for 1.8% (207/11,552) of the genes when comparing sympathetic preganglionic MNs with the medial motor column. Lateral and medial MNs showed the least divergence, with 1.3% (150/11,552) of the genes being differentially expressed. These data indicate that the amount of divergence in expression profiles between identified columnar MNs does not strictly correlate with divergence of function as defined by innervation patterns (somatic/muscle vs. autonomic/viscera). Classification of the differentially expressed genes with regard to function showed that they underpin all fundamental cell systems and processes, although most differentially expressed genes encode proteins involved in signal transduction. Mining the expression profiles to examine transcription factors essential for MN development suggested that many of the same transcription factors participate in combinatorial codes in embryonic and adult neurons, but patterns of expression change significantly.


Figures

Fig. 1
Fig. 1
Visualizing and sectioning the 3 populations of motoneurons (MNs). A: intraperitoneal injections of Fluoro-Gold and subsequent fluorescent microscopy of cryostat sections were used to visualize individual MNs in the spinal cord. The 3 MN subpopulations discussed in the text are as indicated. A hemisection of the spinal cord is outlined, and ventral is downward. This section is from the 1st lumbar segment (L1), the only segment where the 3 populations overlap. B: somatic and visceral MNs are drawn as circles according to scale (see materials and methods). The no. of 8-µm sections usually required to encompass a single neuron is as indicated, although in some instances this number could be reduced by 1. Top indicates the top surface of a section, while bottom faces the slide. Dark gray shading indicates the nonneuronal area that will be captured in the laser capture microdissection (LCM) experiments. The first section of MNs will most likely not be captured, as the Fluoro-Gold signal will be weakened as it penetrates the nonneuronal covering. IML, intermediolateral column; LMN, lateral MN; MMN, medial MN.
Fig. 2
Fig. 2
LCM isolation of fluorescently labeled LMNs, RNA extraction, and aRNA target production. A: fresh frozen section before laser capture. Arrows point to Fluoro-Gold-labeled MNs. Ventral is upward. B: 4 captures (fluorescent MN sections) have been physically isolated using LCM, leaving behind surrounding tissues. Scale bar is 100 µm for both A and B. C: bioanalyzer image of total RNA preparations. Lane 1, 100 ng of whole spinal cord total RNA isolated with a Qiagen RNeasy kit; lane 2, total RNA extracted from 100 LCM captures with the PicoPure kit; lane 3, no template negative control using the Picopure kit. The low-molecular-weight smear appearing in lanes 2 and 3 represents the nucleic acid carrier from the PicoPure extraction buffer. D: bioanalyzer image of aRNA targets. Lanes 1–3, aRNA targets produced from 5 µg (lane 1) or 10 ng (lane 2) of the same whole spinal cord total RNA preparation, or total RNA extracted from 100 LCM captures (lane 3).
Fig. 3
Fig. 3
LCM successfully excludes oligodendrocytes and astrocytes from captured neuronal populations. Quantitative real-time RT-PCR (qRT-PCR) was performed on spinal cord and LMN cDNA templates with primers and probes that specifically recognize classic myelin basic protein (MBP; oligodendrocytes) or glial fibrillary acidic protein (GFAP; astrocytes), and relative signal intensities were obtained. Spinal cord and LMN signals were normalized by the spinal cord signals. Normalized qRT-PCR signals reveal a 99.4 and 97% reduction in classic MBP and GFAP expression, respectively, in the LMN relative to the spinal cord template.
Fig. 4
Fig. 4
Comparisons of expression profiles reveal that biological variability is greater than technical variability, as long as the targets are produced from similar amounts of input RNA. All panels represent the signal intensities for the same probe sets (genes) on 2 microarrays. Each of the data points represents 1 probe set. The y-axis represents the signal intensities for the probe sets on microarray 1, and the x-axis represents the signal intensities on microarray 2. Linear regressions were used to calculate R2. A–C: varying the amount of input RNA alters gene representation in the target. Each panel represents a comparison of the expression profiles obtained from 2 microarrays hybridized to different targets. In all cases, the targets were prepared from the same RNA extracted from the spinal cord of a single rat; however, the amount of input RNA used in target production varied, as indicated on the x-and y-axes (see text). The same ~1,200 genes are represented in all 3 panels. A: each of the 2 targets was produced with 5 µg of same total rat RNA. B: each of the 2 targets was produced with 10n g of same total rat RNA. C: each target was produced with either 5 µg or 10 ng of the same total rat RNA. D and E: examining technical and biological variability within an LCM population. The no. of probe sets represented in the 2 panels is the same (12,488). D: 400 LMNs were captured from a single mouse, and RNA was extracted (materials and methods). The RNA was split in half, and each one-half was served as the template in target production. The resulting expression profiles of these technical replicates are compared. E: the expression profiles shown in D were averaged and compared with the averaged technical replicates for the LMN population isolated from a second mouse.
Fig. 5
Fig. 5
Seven classes of differentially expressed genes among three cell types. The 3 circles represent 3 groups of genes that are significantly different between IML/LMN (706 probe sets in total), IML/MMN (207 probe sets in total), and LMN/MMN (150 probe sets in total), as determined with a 1-way ANOVA. The Venn diagram suggests that the probe sets can be divided into 7 classes: genes that are uniquely expressed in all 3 cell types (12), genes that are uniquely differentially expressed in IML (149), genes that are uniquely differentially expressed in LMN (73), genes that are uniquely differentially expressed in MMN (4), genes that are differentially expressed between LMN and IML (472), genes that are differentially expressed between MMN and IML (42), and genes that are differentially expressed between LMN and MMN (61). The identities of these genes are listed in Supplemental Table S1.
Fig. 6
Fig. 6
MN expression profiles are more similar to each other than to whole cord expression profiles. Averaged expression profiles for each cell type (n = 5 animals, 10 chips) and whole spinal cord (n = 3 animals, 3 chips) are compared. Each of the 12,488 diamonds represents the average signal intensity for 1 probe set in the 2 different samples. Lines on either side of the midline represent a 2-fold change between samples. Same number of probe sets are examined in all panels (12,488). Linear regressions were used to calculate R2.
Fig. 7
Fig. 7
Two independent measures of differential gene expression. A: for each gene, expression levels were measured with qRT-PCR (open bars) and microarrays (solid bars). Expression levels were measured in 2 different samples: whole spinal cord cDNA (10 ng of starting RNA used in the double-amplification protocol, as described in materials and methods) or LMN cDNA (400 LMN captures used in a double-amplification protocol, as described in materials and methods). For each gene, the larger signal is normalized by the smaller signal, and the resulting fold change is plotted. Positive fold changes indicate that the spinal cord signal > LMN signal. Negative fold changes indicate that the LMN signal > spinal cord signal. Note, the hatches on the y-axis and in the bars representing MBP indicate that large portions of the graph have been removed (from 50 to 150) to fit all the data into the figure. B: normalized microarray signal intensities for each gene indicated directly above in A.
Fig. 8
Fig. 8
Reticulocalbin protein levels vary across cell types as predicted by expression profiles. Cryostat sections of Fluoro-Gold-injected mice were stained with anti-reticulocalbin as described. Cell types are indicated at top. For each cell type, the top and bottom panels represent 2 independent sections; the left panels show reticulocalbin staining and the right panels Fluoro-Gold staining for the same section. For each cell type, MNs at top are demarcated by dotted circles (IML) or arrows (MMN and LMN). MNs are not indicated in the bottom sections.

References

    1. Abraham KE, McGinty JF, Brewer KL. Spinal and supraspinal changes in opioid mRNA expression are related to the onset of pain behaviors following excitotoxic spinal cord injury. Pain. 2001;90:181–190. - PubMed
    1. Bajaj MS, Kuppuswamy MN, Manepalli AN, Bajaj SP. Transcriptional expression of tissue factor pathway inhibitor, thrombomodulin and von Willebrand factor in normal human tissues. Thromb Haemost. 1999;82:1047–1052. - PubMed
    1. Baro DJ, Levini RM, Kim MT, Willms AR, Lanning CC, Rodriguez HE, Harris-Warrick RM. Quantitative single-cell-reverse transcription-PCR demonstrates that A-current magnitude varies as a linear function of shal gene expression in identified stomatogastric neurons. J Neurosci. 1997;17:6597–6610. - PMC - PubMed
    1. Baugh LR, Hill AA, Brown EL, Hunter CP. Quantitative analysis of mRNA amplification by in vitro transcription. Nucleic Acids Res. 2001;29:E29. - PMC - PubMed
    1. Bolstad BM, Irizarry RA, Astrand M, Speed TP. A comparison of normalization methods for high density oligonucleotide array data based on variance and bias. Bioinformatics. 2003;19:185–193. - PubMed

Publication types

Substances