. 2005 Nov 30;25(48):11125-32.
doi: 10.1523/JNEUROSCI.2545-05.2005.

Invasion of hematopoietic cells into the brain of amyloid precursor protein transgenic mice

Affiliations

Invasion of hematopoietic cells into the brain of amyloid precursor protein transgenic mice

Anna K Stalder et al. J Neurosci. .

Abstract

The significance of the peripheral immune system in Alzheimer's disease pathogenesis remains controversial. To study the CNS invasion of hematopoietic cells in the course of cerebral amyloidosis, we used a green fluorescence protein (GFP)-bone marrow chimeric amyloid precursor protein transgenic mouse model (APP23 mice). No difference in the number of GFP-positive invading cells was observed between young APP23 mice and nontransgenic control mice. In contrast, in aged, amyloid-depositing APP23 mice, a significant increase in the number of invading ameboid-like GFP-positive cells was found compared with age-matched nontransgenic control mice. Interestingly, independent of the time after transplantation, only a subpopulation of amyloid deposits was surrounded by invading cells. This suggests that not all amyloid plaques are a target for invading cells or, alternatively, all amyloid plaques attract invading cells but only for a limited time, possibly at an early stage of plaque evolution. Immunological and ultrastructural phenotyping revealed that macrophages and T-cells accounted for a significant portion of these ameboid-like invading cells. Macrophages did not show evidence of amyloid phagocytosis at the electron microscopic level, and no obvious signs for T-cell-mediated inflammation or neurodegeneration were observed. The observation that hematopoietic cells invade the brain in response to cerebral amyloidosis may hold an unrecognized therapeutic potential.


Figures

Figure 1.
Figure 1.
Experimental groups studied. APP23 mice and littermate controls at various ages were lethally irradiated and transplanted with GFP-positive bone marrow (Bm). At different times after this procedure, the invasion of peripheral bone marrow cells was analyzed in the neocortex. The following numbers of mice were used per group: group 1, three controls, eight APP23; group 2, four controls, four APP23; group 3, six controls, three APP23; group 4, five controls, five APP23.
Figure 2.
Figure 2.
Increased invasion of peripheral cells into the neocortex of amyloid-depositing APP23 mice. A, Neocortex of a 16-month-old control mouse and 16-month-old APP23 mouse showing the distribution of GFP-positive cells (here immunostained with an antibody to GFP). Congophilic plaques are shown in red. Scale bar, 100 μm. The inset shows a GFP-positive cell closely associated with an amyloid plaque. B, GFP-positive cells were morphologically classified in five distinct subgroups. Scale bars, 20 μm. C, Quantification of total GFP-positive cells revealed a 52% increase (*p < 0.05) in the neocortex of APP23 mice compared with control mice (shown are results for group 1) (Fig. 1). When GFP cells were subgrouped, only ameboid cells were significantly increased (sevenfold; p = 0.002). Similar analysis for groups 2 and 3 also revealed significant increases in ameboid cells (p = 0.006 and p = 0.01, respectively) but not any other cell subtype. No differences in total number or any subgroup of GFP-positive cells were found in young, predepositing APP23 mice (group4) (Fig.1). Error bars represent SD of the total number of GFP-positive cells.
Figure 3.
Figure 3.
Invading ameboid-like cells are associated with a subpopulation of amyloid deposits. A, Neocortical plaque load (%) of the APP23 mice of group 1 was stereologically estimated and correlated with the number of invading ameboid-like GFP-positive cells. Results indicate a positive relationship between plaque load and number of invading cells, although the correlation did not reach statistical significance. B, Similarly, correlative analysis between CAA frequency and ameboid cell count revealed a positive trend. C, Photomicrograph exemplifying the heterogeneous distribution of invading peripheral cells in relation to amyloid plaques. Some plaques were surrounded by a high number of invading cells, whereas neighboring plaques completely lacked invading peripheral cells. The amyloid is stained with Congored, and GFP-immunopositive cells are represented in black. Scale bar, 75 μm.
Figure 4.
Figure 4.
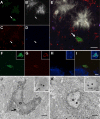
A subpopulation of the ameboid-like cells are macrophages and T-cells. A-I, The fraction of macrophages and T-cells in the ameboid cell population was determined by investigating ameboid-shaped GFP-positive cells for colabeling with a combination of different antibodies using confocal microscopy. To identify macrophages, ameboid-like cells that are positive for GFP and positive for either Iba-1 and/or F4/80 were identified. A, GFP; B, amyloid-staining using Thioflavin-S; C, Iba-1; D, F4/80; E, merged images. Note the ameboid-like GFP-positive macrophage, which is Iba-1 positive but apparently negative for F4/80 (arrow). To identify T-cells, ameboid-like GFP-positive cells that are positive for CD3 were identified. F, GFP; G, CD3; H, amyloid staining using NT12; I, merged images. Another GFP-positive and CD3-positive ameboid-like cell is shown in the insets (F-I). J, K, Electron microscopy was used to identify GFP-positive cells that can be appreciated by the electron-dense immunoprecipitate in the cytoplasm. J, A macrophage that contains a phagosome (arrow) in its cytoplasm. The nucleus is indicated by a circle. A T-cell-like cell is shown in K with its typical nuclear fold (arrowhead). The insets (J, K) are lower magnifications (small arrows indicate the analyzed cell; asterisks indicate the amyloid plaque). Scale bars: E, I, 10 μm; J, K, 2 μm; insets (J, K), 20 μm.

References

    1. Akiyama H, Barger S, Barnum S, Bradt B, Bauer J, Cole GM, Cooper NR, Eikelenboom P, Emmerling M, Fiebich BL, Finch CE, Frautschy S, Griffin WS, Hampel H, Hull M, Landreth G, Lue L, Mrak R, Mackenzie IR, McGeer PL, et al. (2000) Inflammation and Alzheimer's disease. Neurobiol Aging 21: 383-421. - PMC - PubMed
    1. Austyn JM, Gordon S (1981) A monoclonal antibody directed specifically against the mouse macrophage. Eur J Immunol 10: 805-815. - PubMed
    1. Bondolfi L, Calhoun M, Ermini F, Kuhn HG, Wiederhold KH, Walker L, Staufenbiel M, Jucker M (2002) Amyloid-associated neuron loss and gliogenesis in the neocortex of amyloid precursor protein transgenic mice. J Neurosci 22: 515-522. - PMC - PubMed
    1. Bornemann KD, Wiederhold KH, Pauli C, Ermini F, Stalder M, Schnell L, Sommer B, Jucker M, Staufenbiel M (2001) Abeta-induced inflammatory processes in microglia cells of APP23 transgenic mice. Am J Pathol 158: 63-73. - PMC - PubMed
    1. Calhoun ME, Burgermeister P, Phinney AL, Stalder M, Tolnay M, Wiederhold KH, Abramowski D, Sturchler-Pierrat C, Sommer B, Staufenbiel M, Jucker M (1999) Neuronal overexpression of mutant amyloid precursor protein results in prominent deposition of cerebrovascular amyloid. Proc Natl Acad Sci USA 96: 14088-14093. - PMC - PubMed

Publication types

MeSH terms