. 2005 Dec 1;438(7068):628-32.
doi: 10.1038/nature04261.

An assembly landscape for the 30S ribosomal subunit

Affiliations

An assembly landscape for the 30S ribosomal subunit

Megan W T Talkington et al. Nature. .

Abstract

Self-assembling macromolecular machines drive fundamental cellular processes, including transcription, messenger RNA processing, translation, DNA replication and cellular transport. The ribosome, which carries out protein synthesis, is one such machine, and the 30S subunit of the bacterial ribosome is the preeminent model system for biophysical analysis of large RNA-protein complexes. Our understanding of 30S assembly is incomplete, owing to the challenges of monitoring the association of many components simultaneously. Here we have developed a method involving pulse-chase monitored by quantitative mass spectrometry (PC/QMS) to follow the assembly of the 20 ribosomal proteins with 16S ribosomal RNA during formation of the functional particle. These data represent a detailed and quantitative kinetic characterization of the assembly of a large multicomponent macromolecular complex. By measuring the protein binding rates at a range of temperatures, we find that local transformations throughout the assembling subunit have similar but distinct activation energies. Thus, the prevailing view of 30S assembly as a pathway proceeding through a global rate-limiting conformational change must give way to one in which the assembly of the complex traverses a landscape dotted with various local conformational transitions.


Figures

Figure 1.
Figure 1.
The PC/QMS method for measuring protein binding kinetics in the 30S ribosomal subunit. a, Schematic of the method. b, Quantification of relative 15N-protein concentrations for several proteins from standard mixtures of native 15N- and 14N-30S subunits. The average relative intensities for all proteins from the three mixtures were 0.24 ± 0.03, 0.50 ± 0.03, and 0.73 ± 0.04 (errors denote s.d.). c, MALDI-TOF mass spectrum of 30S proteins from the 2-min timepoint of an assembly reaction performed under standard conditions. The inset shows expanded spectra for several timepoints for proteins S18 and S13. Additional details are provided in Supplementary Information.
Figure 2.
Figure 2.
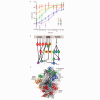
Binding kinetics for 30S proteins from PC/QMS under standard conditions. a, Representative progress curves for protein binding (see Supplementary Fig. S2), fit as described in Methods. The error bars are derived from the s.d. of standard samples (Supplementary Information). b, Proteins in the Nomura assembly map, , are coloured by their binding rates (Supplementary Table S1) (red: 20 - ≥30 min-1, gold: 8.1 - 15 min-1, green: 1.2 - 2.2 min-1, blue: 0.38 - 0.73 min-1, purple: 0.18 - 0.26 min-1). S5 is shown in green and blue to represent the binding rates of the unacetylated and acetylated forms, respectively. The grey bar represents 16S rRNA. c, Proteins in an X-ray crystal structure of T. thermophilus 30S are coloured as in b.
Figure 3.
Figure 3.
The ratio of the observed protein binding rates at two concentrations vs. the rates at standard concentration. Ratios of 1.0 or 0.13 (dashed lines) would indicate unimolecular or bimolecular rate-limiting steps, respectively. The errors in kobs (s.d. from the fits of progress curves) are propagated to produce the errors bars. The proteins that bind very rapidly at the standard concentration are not shown, because the rates cannot be accurately determined from the present data. S10 data are not shown due to poor signal. Proteins S6 and S8 have high ratios, similar to two other central domain proteins, S18 and S15. Proteins S16, S17, and S20 have lower ratios, similar to most proteins.
Figure 4.
Figure 4.
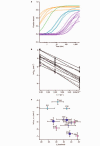
The temperature dependence of protein binding rates. a, The fits of binding progress curves at 15 °C, coloured according to the rates (Supplementary Table S1): orange: 4.4 - 21 min-1; green: 1.0 min-1; aqua: 0.044 - 0.11 min-1; purple: 0.00096 - 0.010 min-1. Post-RI* proteins (S3, S10, and S14) are shown as dashed lines here and in b. b, Arrhenius plots of the observed rates (see Supplementary Fig. S3). The error bars are from the errors in kobs (s.d. from the fits of progress curves). The proteins that bind very rapidly are not shown here or in c. c, Protein binding rates at 15 °C vs. the activation energies (Supplementary Table S1). The errors in Ea are the s.d. from the linear Arrhenius plot fits. Proteins are coloured by 30S domain (magenta: 5′, cyan: central, purple: 3′). Post-RI* proteins have large points.
Figure 5.
Figure 5.
An assembly landscape for 30S assembly. The horizontal axes of the surface correspond to 16S rRNA conformational space, and the vertical axis is free energy. The native conformation of the 16S rRNA adopted in the 30S subunit is located at the bottom corner. In the absence of proteins, this is not the lowest-energy conformation of the RNA. Parallel folding pathways are indicated by the arrows on the energy surface. Local folding creates protein binding sites, and major changes in the landscape accompany protein binding (coloured spheres). Sequential protein binding eventually stabilizes the native 30S conformation. All pathways converge on this point, and there is no bottleneck through which all folding trajectories must pass.
Figure 5.
Figure 5.
An assembly landscape for 30S assembly. The horizontal axes of the surface correspond to 16S rRNA conformational space, and the vertical axis is free energy. The native conformation of the 16S rRNA adopted in the 30S subunit is located at the bottom corner. In the absence of proteins, this is not the lowest-energy conformation of the RNA. Parallel folding pathways are indicated by the arrows on the energy surface. Local folding creates protein binding sites, and major changes in the landscape accompany protein binding (coloured spheres). Sequential protein binding eventually stabilizes the native 30S conformation. All pathways converge on this point, and there is no bottleneck through which all folding trajectories must pass.

Comment in

References

    1. Wimberly BT, et al. Structure of the 30S ribosomal subunit. Nature. 2000;407:327–39. - PubMed
    1. Schluenzen F, et al. Structure of Functionally Activated Small Ribosomal Subunit at 3.3 A Resolution. Cell. 2000;102:615–623. - PubMed
    1. Brodersen DE, Clemons WM, Jr., Carter AP, Wimberly BT, Ramakrishnan V. Crystal structure of the 30 S ribosomal subunit from Thermus thermophilus: structure of the proteins and their interactions with 16 S RNA. J. Mol. Biol. 2002;316:725–768. - PubMed
    1. Moazed D, Stern S, Noller HF. Rapid chemical probing of conformation in 16 S ribosomal RNA and 30 S ribosomal subunits using primer extension. J. Mol. Biol. 1986;187:399–416. - PubMed
    1. Agalarov SC, Williamson JR. A hierarchy of RNA subdomains in assembly of the central domain of the 30 S ribosomal subunit. RNA. 2000;6:402–8. - PMC - PubMed

Publication types