

Shifts in phenology due to global climate change: the need for a yardstick
- PMID: 16321776
- PMCID: PMC1559974
- DOI: 10.1098/rspb.2005.3356
Shifts in phenology due to global climate change: the need for a yardstick
Abstract
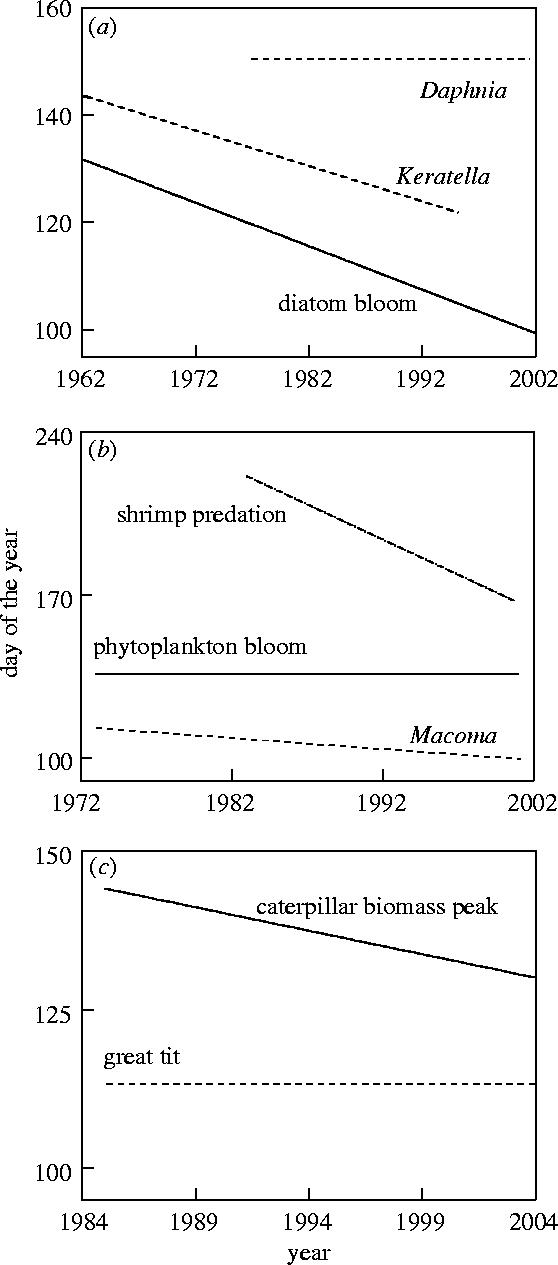
Climate change has led to shifts in phenology in many species distributed widely across taxonomic groups. It is, however, unclear how we should interpret these shifts without some sort of a yardstick: a measure that will reflect how much a species should be shifting to match the change in its environment caused by climate change. Here, we assume that the shift in the phenology of a species' food abundance is, by a first approximation, an appropriate yardstick. We review the few examples that are available, ranging from birds to marine plankton. In almost all of these examples, the phenology of the focal species shifts either too little (five out of 11) or too much (three out of 11) compared to the yardstick. Thus, many species are becoming mistimed due to climate change. We urge researchers with long-term datasets on phenology to link their data with those that may serve as a yardstick, because documentation of the incidence of climate change-induced mistiming is crucial in assessing the impact of global climate change on the natural world.
Figures
References
-
- Baines D, Wilson I.A, Beeley G. Timing of breeding in black grouse Tetrao tetrix and capercaillie Tetrao urogallus and distribution of insect food for the chicks. Ibis. 1996;138:181–187.
-
- Bauer, S., Van Dinther, M., Klaassen, M. & Madsen, J. Submitted. Climate change and Arctic breeding geese—past, present and potential future migration schedules. Global Change Biol.
-
- Beebee T.J.C. Amphibian breeding and climate. Nature. 1995;374:219–220. doi:10.1038/374219a0 - DOI
-
- Both C, Visser M.E. Adjustment to climate change is constrained by arrival date in a long-distance migrant bird. Nature. 2001;411:296–298. doi:10.1038/35077063 - DOI - PubMed
-
- Both C, Visser M.E. The effect of climate change on the correlation between avian life history traits. Global Change Biol. 2005;11:1606–1613.
Publication types
MeSH terms
LinkOut - more resources
Full Text Sources
Medical