. 2005 Dec;187(24):8237-46.
doi: 10.1128/JB.187.24.8237-8246.2005.

Spatial periodicity of Escherichia coli K-12 biofilm microstructure initiates during a reversible, polar attachment phase of development and requires the polysaccharide adhesin PGA

Affiliations

Spatial periodicity of Escherichia coli K-12 biofilm microstructure initiates during a reversible, polar attachment phase of development and requires the polysaccharide adhesin PGA

Konstantin Agladze et al. J Bacteriol. 2005 Dec.

Abstract

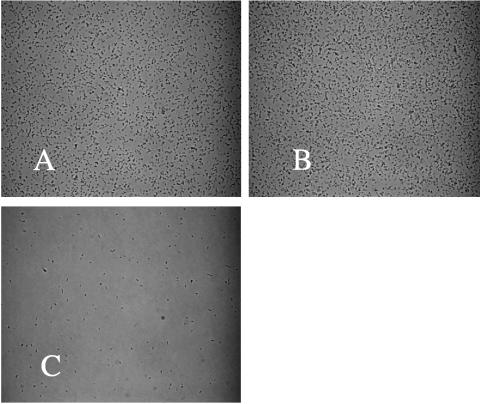
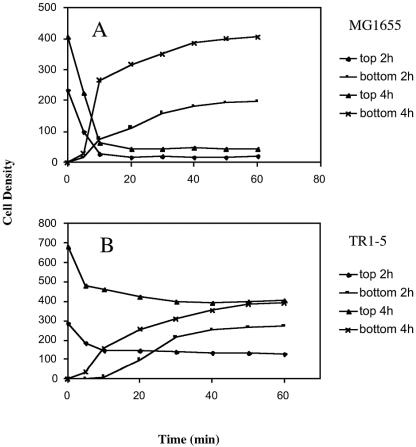
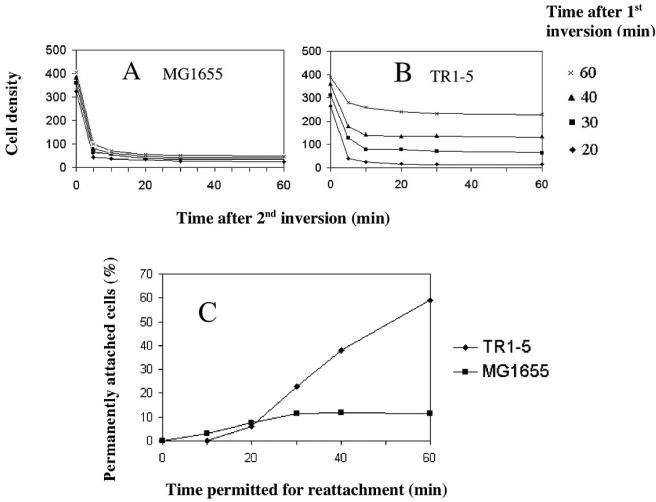
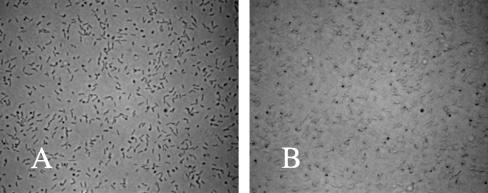
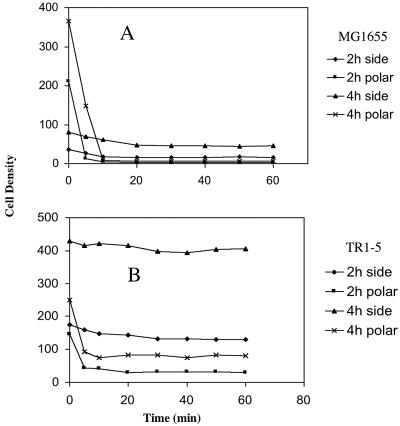
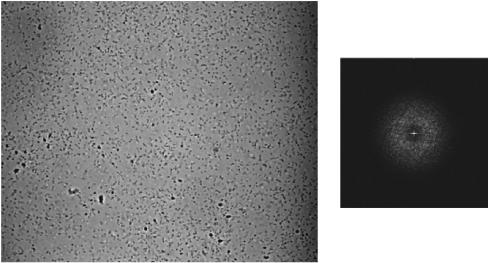
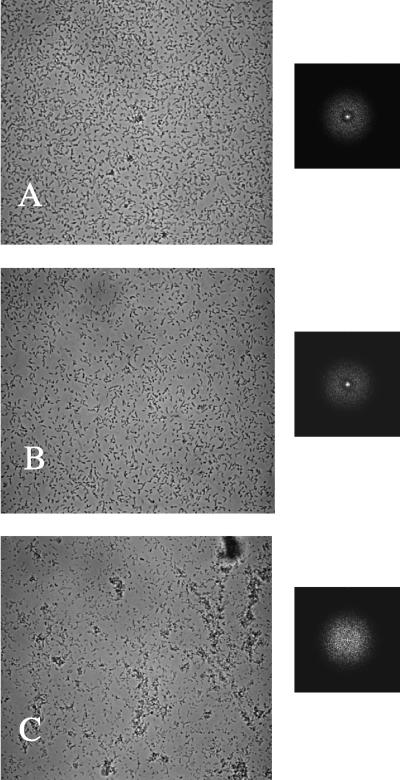
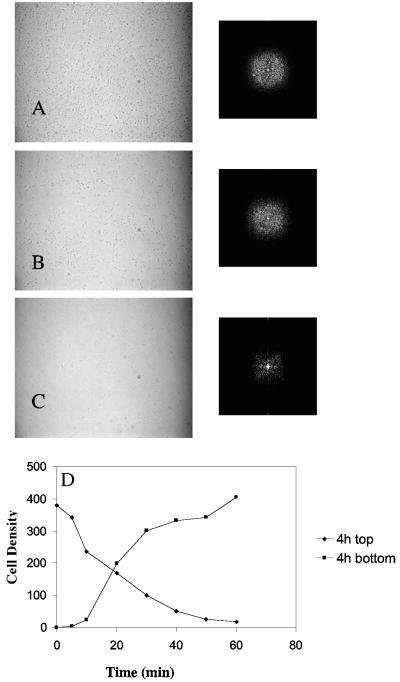
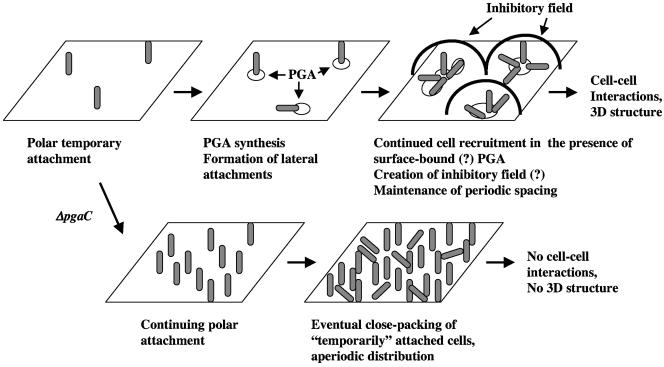
Using fast Fourier transform (FFT) analysis, we previously observed that cells within Escherichia coli biofilm are organized in nonrandom or periodic spatial patterns. Here, we developed a gravity displacement assay for examining cell adherence and used it to quantitatively monitor the formation of two distinct forms of cell attachment, temporary and permanent, during early biofilm development. Temporarily attached cells were mainly surface associated by a cell pole; permanent attachments were via the lateral cell surface. While temporary attachment precedes permanent attachment, both forms can coexist in a population. Exposure of attached cells to gravity liberated an unattached population capable of rapidly reassembling a new monolayer, composed of temporarily attached cells, and possessing periodicity. A csrA mutant, which forms biofilm more vigorously than its wild-type parent, exhibited an increased proportion of permanently attached cells and a form of attachment that was not apparent in the parent strain, permanent polar attachment. Nevertheless, it formed periodic attachment patterns. In contrast, biofilm mutants with altered lipopolysaccharide synthesis (waaG) exhibited increased cell-cell interactions, bypassed the polar attachment step, and produced FFT spectra characteristic of aperiodic cell distribution. Mutants lacking the polysaccharide adhesin beta-1,6-N-acetyl-d-glucosamine (DeltapgaC) also exhibited aperiodic cell distribution, but without apparent cell-cell interactions, and were defective in forming permanent attachments. Thus, spatial periodicity of biofilm microstructure is genetically determined and evident during the formation of temporary cell surface attachments.


Figures

FIG. 1.
FIG. 1.
Appearance of bacterial attachments before and after inversion of the microscopic slide assembly. A culture (MC4100) was incubated for 4 h, and images of attached cells were captured before (A), immediately after (B), and 30 min after (C) inversion of the slide and exposure to gravitational displacement. The frame width of each image is 0.3 mm.
FIG. 2.
FIG. 2.
Bacterial cell density versus time on the top and bottom surfaces of microscopic slide assemblies. Wild-type E. coli strain MG1655 (A) and its isogenic csrA mutant, TR1-5 (B), were allowed to form biofilm for 2 or 4 h on coverslips in CFA medium, as described in Materials and Methods. A slide was assembled and inverted so that the coverslip with the attached bacteria was now facing down. Cell detachment from the coverslip and cell accumulation on the bottom surface of the slide assembly were monitored over time. Density values were calculated as the number of cells per square millimeter divided by 100.
FIG. 3.
FIG. 3.
Kinetics of permanent attachment. A series of coverslips were incubated for 4 h with MG1655 (A) or its isogenic csrA mutant, TR1-5 (B), and slides were assembled and inverted, as described in Fig. 2. Individual slides were inverted a second time at intervals of 20 to 60 min thereafter, as indicated, and the densities of bacterial cells attached to the upper surfaces of the slides were monitored over time. This allowed both the number of cells and the proportion of permanently attached cells to be determined at each time interval. (C) The proportion of permanently attached cells from panels A and B were plotted against the time that was permitted for the gravity-displaced cells to reattach. Cell density values were determined as in Fig. 2.
FIG. 4.
FIG. 4.
Images of polar and laterally attached bacteria. Cells of TR1-5 (csrA) were grown and allowed to attach to a coverslip for 4 h. A slide was assembled containing the cells at the upper surface (see Materials and Methods). Images (×640 magnification) of these cells were taken at the surface of the coverslip (A) or at 1.5 μm below the surface (B). The frame width for each image is 0.2 mm.
FIG. 5.
FIG. 5.
Bacterial cells density versus time for polar and laterally attached bacteria. Analysis of the gravitational detachment of polar and laterally attached cells of MG1655 or its csrA mutant, TR1-5, grown for 2 or 4 h, was performed as described in Fig. 4 legend. Cell density values were determined as in Fig. 2.
FIG. 6.
FIG. 6.
Density pattern of cells detached from a coverslip by gravity and allowed to settle at the bottom of the slide assembly. Strain MG1655 was inoculated and allowed to attach to a coverslip for 4 h. A slide was prepared and inverted, and cells were permitted to detach, settle, and reattach for 20 min before they were photographed (×400 magnification). The corresponding two-dimensional FFT spectrum of the image is shown on the right.
FIG. 7.
FIG. 7.
Images of attached cells (×400 magnification) after 4 h of biofilm growth and corresponding FFT spectra. (A) TR1-5 (csrA); (B) DJ24 (csrA ΔfimB-H ΔmotB); (C) 12E12-6 (DJ24 waaG).
FIG. 8.
FIG. 8.
Cell attachment patterns and displacement kinetics of a ΔpgaC mutant of TR1-5. The culture was grown for 4 h in CFA medium at ambient (∼24°C) temperature, slides were assembled, and photographs were taken immediately (A), 20 min (B), and 60 min (C) later. FFT spectra are shown to the right of the corresponding images. Cell density versus time under gravitational field was calculated as in Fig. 2 and is shown for the top and bottom surfaces of the slide assembly in panel D.
FIG. 9.
FIG. 9.
Working model for the initiation of E. coli K-12 biofilm microstructure. This model is described in the Discussion. Hypothetical steps of the model are indicated by “(?)”.

References

    1. Agladze, K., D. Jackson, and T. Romeo. 2003. Periodicity of cell attachment patterns during Escherichia coli biofilm development. J. Bacteriol. 185:5632-5638. - PMC - PubMed
    1. Annachhatre, A. P., and S. M. Bhamidimarri. 1992. Microbial attachment and growth in fixed-film reactors: process startup considerations. Biotechnol. Adv. 10:69-91. - PubMed
    1. Caiazza, N. C., and G. A. O'Toole. 2004. SadB is required for the transition from reversible to irreversible attachment during biofilm formation by Pseudomonas aeruginosa PA14. J. Bacteriol. 186:4476-4485. - PMC - PubMed
    1. Chang, I., E. S. Gilbert, N. Eliashberg, and J. D. Kiesling. 2004. A three-dimensional, stochastic simulation of biofilm growth and transport-related factors that affect structure. Microbiology 149:2859-2871. - PubMed
    1. Costerton, J. W., Z. Lewandowski, D. E. Caldwell, D. R. Korber, and H. M. Lappin-Scott. 1995. Microbial biofilms. Annu. Rev. Microbiol. 49:711-745. - PubMed

Publication types

MeSH terms

LinkOut - more resources