

Simulation of Sahel drought in the 20th and 21st centuries
- PMID: 16322101
- PMCID: PMC1312412
- DOI: 10.1073/pnas.0509057102
Simulation of Sahel drought in the 20th and 21st centuries
Erratum in
- Proc Natl Acad Sci U S A. 2006 Jan 24;103(4):1152-3
Abstract
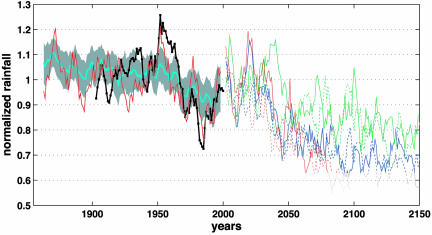
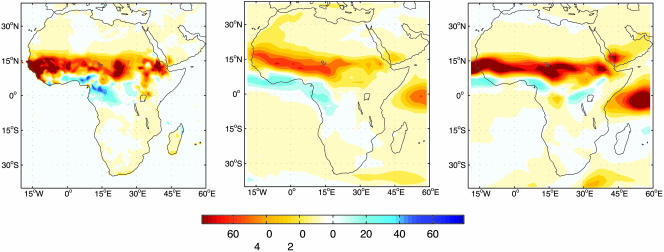
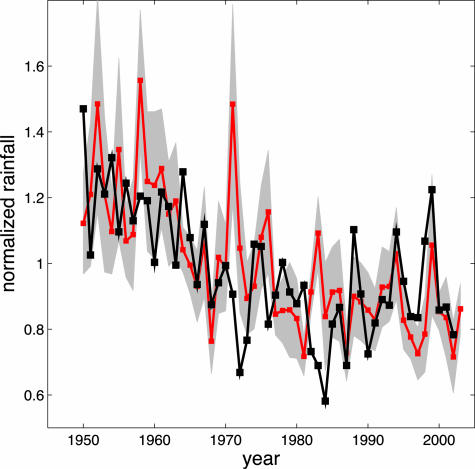
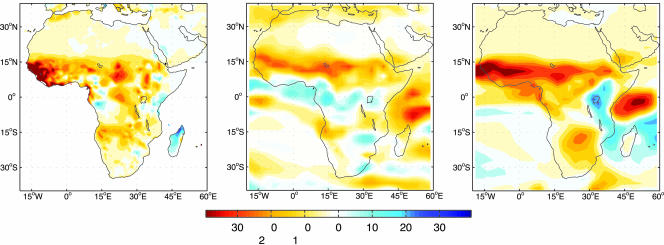
The Sahel, the transition zone between the Saharan desert and the rainforests of Central Africa and the Guinean Coast, experienced a severe drying trend from the 1950s to the 1980s, from which there has been partial recovery. Continuation of either the drying trend or the more recent ameliorating trend would have far-ranging implications for the economy and ecology of the region. Coupled atmosphere/ocean climate models being used to simulate the future climate have had difficulty simulating Sahel rainfall variations comparable to those observed, thus calling into question their ability to predict future climate change in this region. We describe simulations using a new global climate model that capture several aspects of the 20th century rainfall record in the Sahel. An ensemble mean over eight realizations shows a drying trend in the second half of the century of nearly half of the observed amplitude. Individual realizations can be found that display striking similarity to the observed time series and drying pattern, consistent with the hypothesis that the observations are a superposition of an externally forced trend and internal variability. The drying trend in the ensemble mean of the model simulations is attributable to anthropogenic forcing, partly to an increase in aerosol loading and partly to an increase in greenhouse gases. The model projects a drier Sahel in the future, due primarily to increasing greenhouse gases.
Figures
References
-
- Dai, A., Lamb, P. J., Trenberth, K. E., Hulme, M., Jones, P. D. & Xie, P.-P. (2004) Int. J. Climatol. 24, 1323–1331.
-
- Charney, J. G. (1975) Quart. J. R. Meteorol. Soc. 101, 193–202.
-
- Nicholson, S. (2000) Rev. Geophys., 38, 1, 117–139.
-
- Xue, Y. & Shukla, J. (1993) J. Climate 6, 2232–2245.
-
- Taylor, C. M., Lambin, E. F., Stephenne, N., Harding, R. J. & Essery, R. L. H. (2002) J. Climate 15, 3615–3629.
Publication types
MeSH terms
LinkOut - more resources
Full Text Sources
Medical
