. 2005 Dec 1;19(23):2816-26.
doi: 10.1101/gad.1362105.

Biochemical and genetic analysis of the yeast proteome with a movable ORF collection

Affiliations

Biochemical and genetic analysis of the yeast proteome with a movable ORF collection

Daniel M Gelperin et al. Genes Dev. .

Abstract

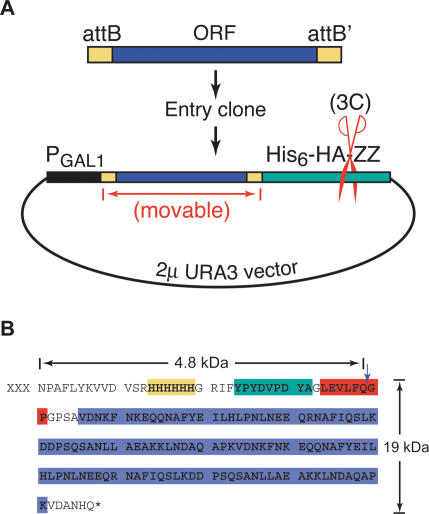
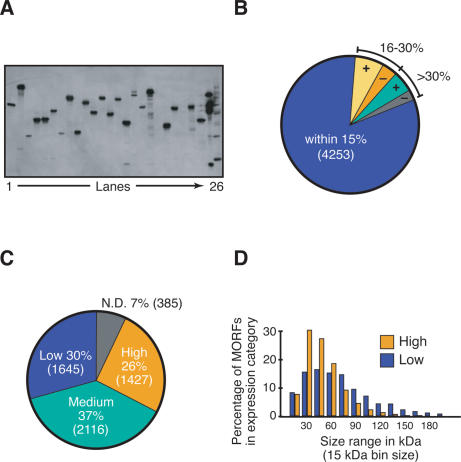
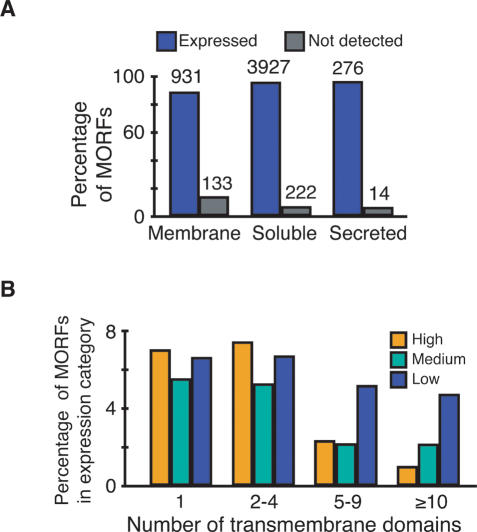
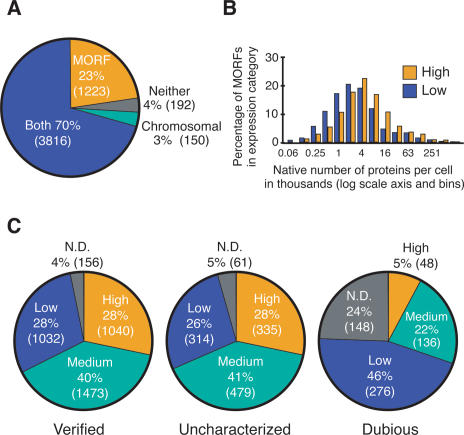
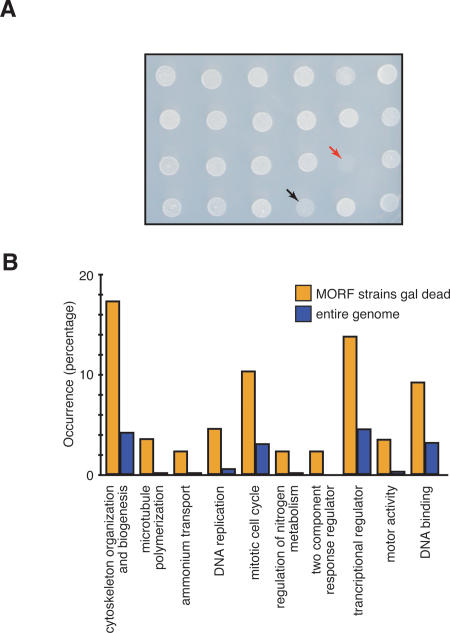
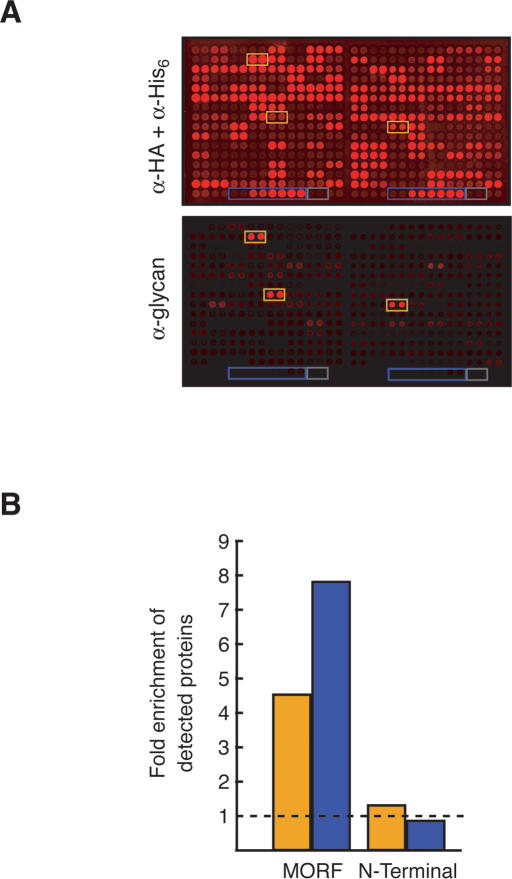
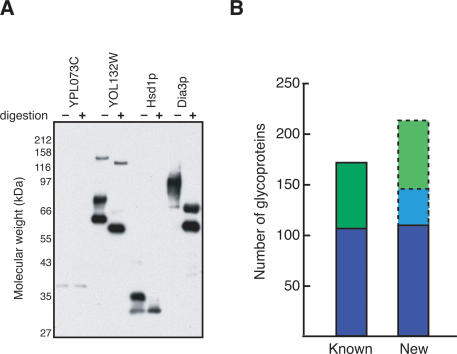
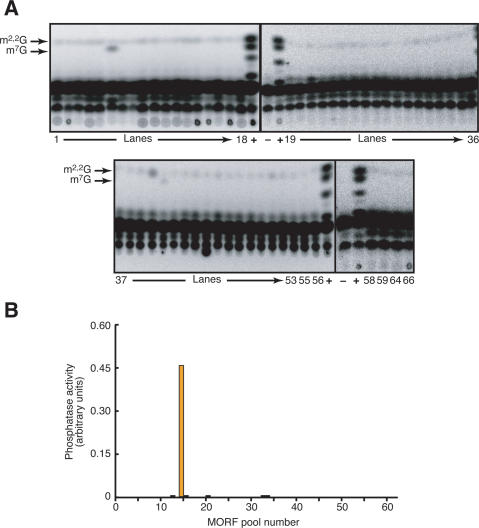
Functional analysis of the proteome is an essential part of genomic research. To facilitate different proteomic approaches, a MORF (moveable ORF) library of 5854 yeast expression plasmids was constructed, each expressing a sequence-verified ORF as a C-terminal ORF fusion protein, under regulated control. Analysis of 5573 MORFs demonstrates that nearly all verified ORFs are expressed, suggests the authenticity of 48 ORFs characterized as dubious, and implicates specific processes including cytoskeletal organization and transcriptional control in growth inhibition caused by overexpression. Global analysis of glycosylated proteins identifies 109 new confirmed N-linked and 345 candidate glycoproteins, nearly doubling the known yeast glycome.


Figures

Figure 1.
Figure 1.
MORF plasmid structure. (A) Diagram of MORF expression vector. PCR amplification of ORFs results in addition of directional attB sequences directly abutting the initiating ATG and the final sense codon. After two rounds of recombination, the ORF, again flanked by directional attB sequences, is cloned into vector pBG1805 (described in Supplemental Material) in frame with a triple affinity tag comprised of His6-HAepitope-3Cprotease site-ZZproteinA. (B) C-terminal affinity tag. Purified proteins have a 4.8-kDa tag including His6 (gold) and a single HA epitope (green) after cleavage with 3C protease. Before cleavage, the entire tag is 19 kDa, including an IgG-binding ZZ domain (blue) and a 3C protease cleavage site (red). MORF clones are available from Open Biosystems (http://www.openbiosystems.com).
Figure 2.
Figure 2.
MORF expression. (A) Detection of MORF fusion protein expression. Yeast cells containing different MORFs were induced for expression of fusion proteins, and whole-cell lysates were subjected to SDS-PAGE and analyzed by immunoblot with anti-HA antibody (Materials and Methods). (Lanes 1–24) Different MORF clones. (Lane 25) MORF fusion proteins purified by immobilized metal ion affinity chromatography (Supplemental Material): Ura1-His6-HA-ZZp (54 kDA), Tkl1-His6-HA-ZZp (93 kDa), and Lys1-His6-HA-ZZp (60 kDa). (Lane 26) Invitrogen MagicMark XP Western Protein Standards. (B) Comparison of predicted MORF protein size to observed SDS-PAGE migration. A total of 349 MORF proteins run 16%–30% slower than predicted, while 177 run 16%–30% faster; 278 MORF proteins run >30% slower than predicted, while 130 run >30% faster. (C) Classification of MORFs based on expression levels. (N.D.) Not detected. (D) Molecular weight distribution of MORF proteins in high and low expression categories. Proteins in high (yellow) and low (blue) expression categories were binned according to predicted native molecular weight, without the tag. The upper limit of the size range is indicated on the X-axis. To remove ORFs whose expression might be compromised by an unstable polypeptide, only ORFs that are classified as verified and uncharacterized by SGD were included in the analysis.
Figure 3.
Figure 3.
Membrane protein expression. (A) Expression of MORF fusion proteins predicted to encode soluble, secreted, or membrane proteins. (Blue) Expressed proteins; (gray) not detected. (B) Effect of transmembrane domains on expression levels. TMHMM was used to predict the number of transmembrane domains, and ORFs in each expression category were sorted into the bins indicated. (Yellow) High expression; (green) medium expression; (blue) low expression.
Figure 4.
Figure 4.
Comparison of MORF expression with native protein expression and ORF status. (A) Comparison of expression of proteins in the MORF collection with two chromosomally tagged collections. All ORFs tagged and analyzed in both collections were compared. An additional 551 ORFs from which expression was detected using chromosomal tags are not included in the analysis since they were not tested in the yeast MORF collection; 208 of these have been cloned in the MORF collection, but not examined in yeast. (B) Comparison of expression levels of chromosomally tagged collection and MORF collection. Proteins in high (yellow) and low (blue) expression categories were binned based on the estimates of the native number of molecules per cell, as measured with chromosomal TAP tags (Ghaemmaghami et al. 2003). The upper limits of these estimates are shown on the X-axis, which is a log scale. Dubious ORFs, as well as MORF clones, severely compromised for growth on raffinose or raffinose + galactose were discarded prior to analysis. (C) Analysis of expression of verified, uncharacterized, and dubious ORFs.
Figure 5.
Figure 5.
Examination of the effects of MORF expression on growth. (A) Growth of yeast strains on medium containing raffinose + galactose. Arrows indicate strains with no growth (red) or slow growth (black) 48 h after transfer of strains from minimal medium containing glucose to medium containing raffinose and galactose. (B) Functions defined by MORF strains that fail to grow in galactose + raffinose. The 88 genes of MORF strains that fail to grow in galactose + raffinose are grouped according to biological or molecular function as defined using the SGD Gene Ontology Term Finder at http://db.yeastgenome.org/cgi-bin/GO/goTermFinder. The percentage of ORFs in a particular GO category is shown for the 88 lethal genes (yellow) and the genome (blue). The data are plotted in order of decreasing P-values in the Biological GO groups through regulation of nitrogen metabolism; Molecular Function GO groups are shown next. The P-values range from 1.99E-6 to 6.5E-3, and individual values are reported in Supplementary Table S6 together with categories enriched by growth on galactose, glycerol, and ethanol. The P-values for the transcription regulators category are 4.8E-04 among the 88 galactose + raffinose set and 1.97E-09 among the galactose, glycerol, and ethanol set, although they are enriched to nearly the same representation in both sets of genes.
Figure 6.
Figure 6.
Identification of yeast glycoproteins. (A) Detection of glycoproteins on a protein chip. Two blocks (out of 48) of a protein chip of 5573 C-terminally tagged proteins printed in duplicate are shown, probed with anti-HA and anti-His6 antibodies (top) or anti-yeast glycan antibody (bottom). Each block contains a dilution series of Leu2p (boxed in blue) and elution buffer alone (gray). Representative reactive candidate glycoproteins are boxed in orange. (B) Known glycoprotein enrichment in candidate list. There is a 4.5-fold enrichment of known glycoproteins (orange) in the MORF candidate list compared with the proteins on the chip. Such proteins comprise 10.8% of the candidates, but only 2.4% of the proteins on the chip. Similar calculations were done for GPI-linked proteins (blue, 7.8-fold). In contrast, no enrichment was seen when probing an N-terminally tagged collection (1.3-fold for glycoproteins, 0.8-fold for GPI-linked proteins).
Figure 7.
Figure 7.
Validation of candidate glycoproteins. (A) Western blot of candidate glycoproteins in gel-shift assay. Purified proteins were mock-treated (-) or digested with Endo H and PNGase F (+) to remove N-linked glycans before Western blot analysis with anti-HA antibody to detect mobility shifts. (B) New glycoproteins identified. Known N-linked glycoproteins (blue) and total known glycoproteins (green) in the genome are shown. Newly identified N-linked glycoproteins confirmed by Endo H and PNGase gel-shift (109 of 344 tested) are shown in blue. Based on the rate of gel-shift for known glycoproteins and known N-linked glycoproteins tested (see text), the projected number of additional new N-linked glycoproteins (35, light blue) and projected total new glycoproteins (217, light green) after testing of the 110 untested candidates are shown.
Figure 8.
Figure 8.
Biochemical activities are detected in the correct, individual protein pools with high sensitivity. MORF strains from each 96-well plate were pooled as described previously (Martzen et al. 1999; Phizicky et al. 2002) and grown, and proteins were purified on IgG sepharose followed by cleavage with 3C protease as described in the Supplemental Material. (A) Detection of two activities that modify single specific nucleotides in tRNAPhe: m2,2G formation catalyzed by Trm1p and m7G formation catalyzed by Trm8p/Trm82p. Plates 54, 57, 60–63, and 65 were eliminated from the yeast strain collection in the process of resorting good clones. (B) Assay for phosphatase activity using paranitrophenylphosphate and colorimetric detection.

Similar articles

Cited by

References

    1. Akada, R., Yamamoto, J., and Yamashita, I. 1997. Screening and identification of yeast sequences that cause growth inhibition when overexpressed. Mol. Gen. Genet. 254: 267-274. - PubMed
    1. Alexandrov, A., Martzen, M.R., and Phizicky, E.M. 2002. Two proteins that form a complex are required for 7-methylguanosine modification of yeast tRNA. RNA 8: 1253-1266. - PMC - PubMed
    1. Apweiler, R., Hermjakob, H., and Sharon, N. 1999. On the frequency of protein glycosylation, as deduced from analysis of the SWISS-PROT database. Biochim. Biophys. Acta 1473: 4-8. - PubMed
    1. Arava, Y., Wang, Y., Storey, J.D., Liu, C.L., Brown, P.O., and Herschlag, D. 2003. Genome-wide analysis of mRNA translation profiles in Saccharomyces cerevisiae. Proc. Natl. Acad. Sci. 100: 3889-3894. - PMC - PubMed
    1. Bader, G.D., Heilbut, A., Andrews, B., Tyers, M., Hughes, T., and Boone, C. 2003. Functional genomics and proteomics: Charting a multidimensional map of the yeast cell. Trends Cell. Biol. 13: 344-356. - PubMed

Publication types