. 2005 Dec;115(12):3428-39.
doi: 10.1172/JCI23587.

Identification of autoantibody clusters that best predict lupus disease activity using glomerular proteome arrays

Affiliations

Identification of autoantibody clusters that best predict lupus disease activity using glomerular proteome arrays

Quan-Zhen Li et al. J Clin Invest. 2005 Dec.

Erratum in

  • J Clin Invest. 2006 Feb;116(2):548. Zhen, Quan Li [corrected to Li, Quan-Zhen]

Abstract

Nephrophilic autoantibodies dominate the seroprofile in lupus, but their fine specificities remain ill defined. We constructed a multiplexed proteome microarray bearing about 30 antigens known to be expressed in the glomerular milieu and used it to study serum autoantibodies in lupus. Compared with normal serum, serum from B6.Sle1.lpr lupus mice (C57BL/6 mice homozygous for the NZM2410/NZW allele of Sle1 as well as the FAS defect) exhibited high levels of IgG and IgM antiglomerular as well as anti-double-stranded DNA/chromatin Abs and variable levels of Abs to alpha-actinin, aggrecan, collagen, entactin, fibrinogen, hemocyanin, heparan sulphate, laminin, myosin, proteoglycans, and histones. The use of these glomerular proteome arrays also revealed 5 distinct clusters of IgG autoreactivity in the sera of lupus patients. Whereas 2 of these IgG reactivity clusters (DNA/chromatin/glomeruli and laminin/myosin/Matrigel/vimentin/heparan sulphate) showed association with disease activity, the other 3 reactivity clusters (histones, vitronectin/collagen/chondroitin sulphate, and entactin/fibrinogen/hyaluronic acid) did not. Human lupus sera also displayed 2 distinct IgM autoantibody clusters, one reactive to DNA and the other apparently polyreactive. Interestingly, the presence of IgM polyreactivity in patient sera was associated with reduced disease severity. Hence, the glomerular proteome array promises to be a powerful analytical tool for uncovering novel autoantibody disease associations and for distinguishing patients at high risk for end-organ disease.


Figures

Figure 1
Figure 1
Target Ags and specificity profiles of glomerular proteome arrays. (A) HydroGel slides were coated with different glomerular/GBM and nuclear Ags in duplicate as shown. Deramatan sulphate, deramatan sulphate proteoglycan; glom. extract, glomerular extract; HS, heparan sulphate. (BG) Six commercially available mAbs specific for vimentin (B), hemocyanin (C), collagen IV (D), fibrinogen IV (E), elastin (F), and myosin (G) were added to 6 separate glomerular proteome arrays and developed using Cy5-labeled goat anti-mouse IgG/IgM in order to gauge the specificity of the Ag/Ab interactions on the glomerular proteome arrays. The Ags in BG were arrayed as shown in A.
Figure 2
Figure 2
The use of glomerular proteome arrays to uncover autoantibodies in murine lupus sera. Dilutions (1:200) of various sera were applied to HydroGel slides coated with different glomerular/GBM and nuclear Ags as shown in Figure 1A. (A) Representative glomerular proteome arrays hybridized with B6 (bottom) or B6.Sle1.lpr sera (top) and developed with Cy5-coupled anti-mouse IgG. In these arrays, the intensity of the fluorescence signal ranged from none (black) to high (red), as scanned at 635 nM. (B) A total of 12 B6 sera and 15 B6.Sle1.lpr sera (10 females, 5 males) were studied similarly, and the data summarized in a heat map which shows the relative IgG seroreactivities of each of these 27 serum samples to the respective Ags on the arrays. For all Ags, the reactivity intensities are depicted on a relative scale, where reactivities above the array mean are colored red, reactivities below are colored green, and reactivities close to the mean are colored black. In addition, a clustering algorithm was used to group together sera that exhibited similar reactivity patterns (dendrogram at top) and to cluster together Ags that were similarly targeted by the different test sera (dendrogram at left). Data in B are representative of at least 3 independent experiments (using the same sera, but independent arrays).
Figure 3
Figure 3
The strongest IgG and IgM antiglomerular reactivities in B6.Sle1.lpr lupus sera. (A) IgG seroreactivities to various glomerular and nuclear Ags assayed in B6 (n = 12) and B6.Sle1.lpr mice (n = 15, 10 females and 5 males) are partitioned according to whether the observed reactivities in the lupus sera were stronger than 1,000 nfi (top) or 100–1,000 nfi (bottom). Among the B6 sera, there were no significant differences between genders; therefore data from B6 males and females have been pooled. P values at left compare B6.Sle1.lpr with the corresponding B6 values (P1) and differences between gender in B6.Sle1.lpr sera (P2). *P < 0.05; **P < 0.01; ***P < 0.001. Note that the reactivity levels of B6.Sle1.lpr female sera to chromatin and dsDNA exceeded 20,000 nfi. (B) The strongest IgM seroreactivities (>300 nfi) noted in 15 B6.Sle1.lpr sera (10 females, 5 males) using glomerular proteome arrays are compared with the corresponding B6 levels (n = 12). P values at right compare the 2 strains. (C) Some of the highest fluorescence reactivities observed in B6.Sle1.lpr sera, categorized according to their IgG subclass. In similar assays, the reactivities observed in B6 control sera ranged from 20–100 nfi (data not plotted). Agg, aggrecan; CL, cardiolipin; Chr, chromatin; Col, collagen type IV; ds, dsDNA; Fib, fibrinogen IV; GBM, total glomerular lysate; Mat, Matrigel; Myo, myosin.
Figure 4
Figure 4
DNA dependence of glomerular-reactive autoantibodies in lupus. For all the B6 and B6.Sle1.lpr mouse sera studied (total, n = 27; A and B), the reactivity to DNA/chromatin was compared to the reactivities to total glomerular lysate or Matrigel, within the same serum samples. Shown are the scatter plots (and correlation coefficients) relating mouse IgG reactivities against chromatin versus Matrigel (A) and mouse IgM reactivity against dsDNA versus glomerular extract (B). (C and D) Mean remnant IgG (C) and IgM (D) seroreactivities to dsDNA or to the different glomerular Ags following DNAse-I pretreatment of the glomerular proteome array slides, the test sera alone, or both, expressed as a percentage of the fluorescence intensities recorded in sham-treated controls, arbitrarily set at 100%. Each bar represents the mean value derived from 3 individual B6.Sle1.lpr serum samples that had expressed high reactivity to the depicted glomerular targets. All IgG seroreactivities remaining after both the sera and the Ag arrays were DNAse-I treated (C) were significantly less than the sham-treated controls (P < 0.05 for fibrinogen IV; P < 0.01 for myosin; and P < 0.001 for all the other Ags), with the exception of α-actinin (P > 0.05). Likewise, all IgM seroreactivities remaining after both the sera and the Ag arrays were DNAse-I treated (D) were significantly less than the sham-treated controls (P < 0.01 for aggrecan and P < 0.001 for the other Ags), with the exceptions of fibrinogen IV and α-actinin (P > 0.05).
Figure 5
Figure 5
The strongest IgG antiglomerular reactivities in human lupus sera. Sera from 11 healthy adults (NHS), 37 lupus patients (SLE) with varying degrees of disease (see Table 1), and 5 RA patients were applied to the glomerular proteome arrays as shown in Figure 1A and developed using Cy5-labeled anti-human IgG. The relative fluorescence intensities for each Ag are depicted using a green/black/red heat map and clustered Ag-wise as described in the legend to Figure 2B. Indicated on the left margin are 5 distinct groups of Ags, the reactivities to which were noted to cluster together in the tested samples. Depicted results are representative of 2 independent experiments using the same sera but fresh arrays. P values indicated at right were the result of comparing the lupus sera against the normal controls. An additional SLE column has been included which shows results from 1 duplicated sample. *P < 0.05; **P < 0.01.
Figure 6
Figure 6
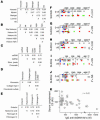
Five distinct clusters of IgG autoreactivity in lupus sera. (AE) The autoantigen seroreactivities that apparently clustered together in Figure 5 were reassessed for correlation in a pairwise fashion. Indicated within each matrix are the corresponding correlation coefficients when seroreactivity to the different Ags were compared for concordance. For array Ags not listed in A, the seroreactivity correlation coefficients between any 2 Ags were r < 0.2, with the exception of concordance between SS-A/SS-B and Sm/RNP seroreactivity. (FJ) Seroreactivity levels noted in lupus sera (n = 37) against the 5 clusters of targeted Ags, parsed according to their total SLEDAI scores. When available, glomerular pathology class was indicated (red, grade IV GN; green, grade II/III GN; blue, grade V GN; white, no biopsy done). (F) For cluster 1 Ags, reactivity to laminin is plotted as the cluster’s representative. (G) For cluster 2 Ags, reactivity to total histone is plotted as the cluster’s representative. (H) For cluster 3 Ags, reactivity to dsDNA is plotted as the cluster’s representative. (I) For cluster 4 Ags, reactivity to chondroitin sulphate is plotted as the cluster’s representative. (J) For cluster 5 Ags, reactivity to fibrinogen IV is plotted as the cluster’s representative. The dotted line within each plot pertains to the cutoff for normality, representing mean ± 2 SD noted in the 11 normal control sera studied. (K) Scatter-plotted serum concentrations of complement C3 (y axis) versus IgG anti-dsDNA Ab levels (representative of cluster 3 seroreactivity; x axis).
Figure 7
Figure 7
The strongest IgM antiglomerular reactivities in human lupus sera. (A) Sera from 11 healthy adults, 37 lupus patients with varying degrees of disease (see Table 1), and 5 RA patients were applied to the glomerular proteome arrays as shown in Figure 1A and developed using Cy3-labeled anti-human IgM. The relative fluorescence intensities for each Ag are depicted using a green/black/red heat map and clustered Ag-wise as described in the legend to Figure 2B. Indicated on the left are a panel of Ags that clustered together, most likely serving as targets for polyreactive Abs. Depicted results are representative of 2 independent experiments using the same sera but fresh arrays. Two additional SLE columns have been included which show results from 2 duplicated samples. (B) For each normal control (n = 11; white dots), RA control (n = 5; black dots), and lupus patient (n = 37; blue dots, total SLEDAI score 0–8; red dots, total SLEDAI score >8), the mean serum IgM anti-DNA reactivity (y axis) was derived by averaging the observed reactivity to ssDNA, dsDNA, and chromatin on the arrays and scatter plotted against the average extent of serum IgM polyreactivity (x axis) to the bottom-most 26 array Ags clustered together in the heat map shown in A. The dotted lines were arbitrarily set to distinguish patients with high IgM anti-DNA Abs and/or high IgM polyreactivity in their sera.

References

    1. Kotzin BL. Systemic lupus erythematosus. Cell. 1996;85:303–306. - PubMed
    1. Hahn BH. Antibodies to DNA. N. Engl. J. Med. 1998;338:1359–1368. - PubMed
    1. Lefkowith JB, Gilkeson GS. Nephritogenic autoantibodies in lupus. Current concepts and continuing controversies. Arthritis Rheum. 1996;39:894–903. - PubMed
    1. Foster MH, Kelley VR. Lupus nephritis: update on pathogenesis and disease mechanisms. Semin. Nephrol. 1999;19:173–181. - PubMed
    1. Madaio MP, et al. Murine monoclonal anti-DNA antibodies bind directly to glomerular antigens and form immune deposits. J. lmmunol. 1987;138:2883–2889. - PubMed

Publication types

MeSH terms