. 2005 Dec 2;123(5):889-901.
doi: 10.1016/j.cell.2005.09.020.

Deconstructing the cadherin-catenin-actin complex

Affiliations

Deconstructing the cadherin-catenin-actin complex

Soichiro Yamada et al. Cell. .

Abstract

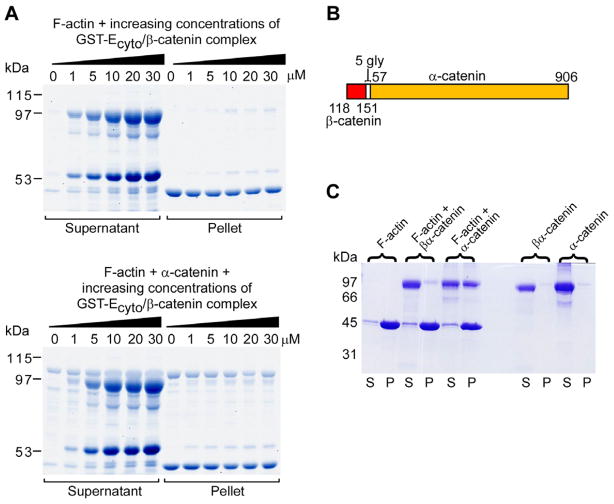
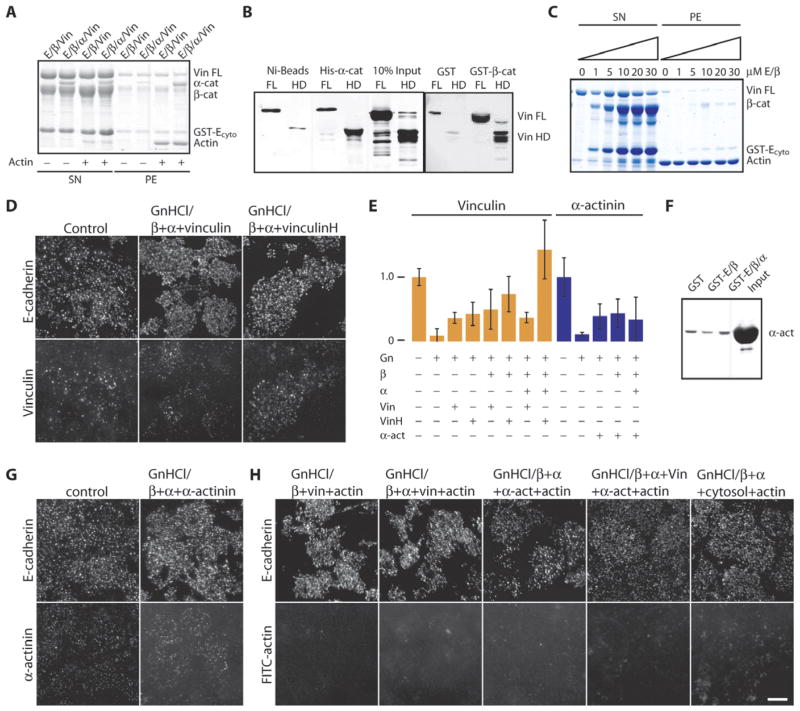
Spatial and functional organization of cells in tissues is determined by cell-cell adhesion, thought to be initiated through trans-interactions between extracellular domains of the cadherin family of adhesion proteins, and strengthened by linkage to the actin cytoskeleton. Prevailing dogma is that cadherins are linked to the actin cytoskeleton through beta-catenin and alpha-catenin, although the quaternary complex has never been demonstrated. We test this hypothesis and find that alpha-catenin does not interact with actin filaments and the E-cadherin-beta-catenin complex simultaneously, even in the presence of the actin binding proteins vinculin and alpha-actinin, either in solution or on isolated cadherin-containing membranes. Direct analysis in polarized cells shows that mobilities of E-cadherin, beta-catenin, and alpha-catenin are similar, regardless of the dynamic state of actin assembly, whereas actin and several actin binding proteins have higher mobilities. These results suggest that the linkage between the cadherin-catenin complex and actin filaments is more dynamic than previously appreciated.


Figures

Figure 1
Figure 1. Reconstitution of the Cadherin-Catenin Complex but Not Actin Binding
(A) F-actin pelleting assay with the E-cadherin-β-catenin-α-catenin complex. F-actin was incubated with increasing amounts of E-cadherin-β-catenin complex (control, top gel) or with 5 μM α-catenin and increasing amounts of preformed Ecyto-β-catenin complex (bottom gel). Supernatant and pellet at each concentration point were analyzed by SDS-PAGE and CBB staining. (B) Scheme of the βα-catenin construct. N- and C-terminal residues of the β-catenin (red) and α-catenin (yellow) sequence are indicated on the bottom and top, respectively. (C) Pelleting assay with βα-catenin or α-catenin and F-actin, or βα-catenin or α-catenin without F-actin. S, supernatant containing the unbound protein; P, pellet containing actin bound protein.
Figure 2
Figure 2. The Interaction of α-Catenin with β-Catenin or F-Actin Is Unaffected by E-Cadherin Clustering
(A) Scheme of the COMP-E-cadherin cytoplasmic domain construct. N-and C-terminal residues of the COMP (green) and the E-cadherin (blue) sequence are indicated. (B) GST-E-cadherin (left gel) or GST-COMP-E-cadherin (right gel), each at a concentration of 10 μM, was incubated with 10 μM β-catenin and increasing amounts of α-catenin. Protein complexes were isolated with glutathione agarose and analyzed by SDS-PAGE and CBB staining. (C) F-actin pelleting assay with β-catenin, Ecyto, COMP-Ecyto, and either Ecyto or COMP-Ecyto bound to β-catenin and α-catenin; proteins were incubated with F-actin in a 1:1 ratio. After pelleting, the supernatant (S) and pellet (P) were analyzed by SDS-PAGE and CBB staining.
Figure 3
Figure 3. Reconstitution of the Cadherin-Catenin Complex on Membrane Patches
(A) Scheme of chemical assembly of E-cadherin:Fc on a cover slip and generation of membrane patches. A glass coverslip is silanized with a long-chain silane containing a free amino group, to which sulfo-NHS-biotin is linked. NeutrAvidin and biotinylated protein A are added sequentially, followed by purified E-cadherin:Fc. MDCK GII cells are allowed to adhere through the interaction of cellular E-cadherin with E-cadherin:Fc for 6 hr. After crosslinking with BS3, cells are swollen in hypotonic buffer and sonicated briefly, leaving behind the basal membrane with its cytoplasmic side exposed (for details, see Drees et al., 2004). (B) Fluorescent images of fixed membrane patches showing staining with the membrane dye DiI or antibodies against actin, E-cadherin intracellular domain, β-catenin, and α-catenin. (C) Indirect immunofluorescence of E-cadherin, β-catenin (β-cat), or α-catenin (α-cat) on membrane patches after stripping with 4 M guanidine hydrochloride (GnHCl) and readdition of purified protein (+β-cat or α-cat, or +β-cat and α-cat). (D) Quantification of β- and α-catenin binding to membrane patches, measured as the intensity of immunofluorescence signal of both proteins relative to the intensity of anti-E-cadherin immunofluorescence and normalized to their control staining. Gn, 4 M guanidine hydrochloride treated; β, 1 μM β-catenin added; α, 5 μM α-catenin added; P, α- or β-catenin prephosphorylated with casein kinase II. Error bars show SEM. (E) Membranes were treated as in (C) and subsequently incubated with 5 μM G-actin containing 10% fluorescein-labeled actin under polymerizing conditions. Membranes were fixed before immunostaining with antibodies against E-cadherin intracellular domain. Scale bar, 10 μm.
Figure 4
Figure 4. Vinculin and α-Actinin Interaction with α-Catenin
(A) Actin pelleting assay with GST-Ecyto (E), β-catenin (β), α-catenin (α), and full-length vinculin (Vin FL). The supernatant (SN) and pellet (PE) were analyzed by SDS-PAGE and CBB staining. (B) Binding of full-length vinculin (Vin FL) or vinculin head domain (Vin HD) to His-α-catenin immobilized on Ni-NTA beads or GST-β-catenin immobilized on glutathione agarose beads. The concentration of proteins immobilized on beads and final concentration of vinculin and vinculin head domain was 10 μM. Following SDS-PAGE, proteins were blotted with anti-vinculin antibody. Background binding to beads is indicated in the leftmost lanes of each gel. (C) Actin pelleting assay with 10 μM full-length vinculin (Vin FL) and increasing concentrations of GST-E-cadherin intracellular domain-β-catenin complex from 1 to 30 μM. The gel was stained with Coomassie blue. (D) Indirect immunofluorescence staining of cellular E-cadherin and vinculin on membrane patches. Control membranes were fixed after sonication. Other membranes were treated with 4 M guanidine hydrochloride, blocked, incubated with the indicated proteins, and fixed. (E) Quantification of binding of vinculin, vinculin head domain, or α-actinin to membrane patches, measured as the intensity of immunofluorescence signal relative to the intensity of anti-E-cadherin immunofluorescence and normalized to the control staining of each protein. Error bars show SEM. (F) Binding assay of α-actinin to the GST-Ecyto-β-catenin-α-catenin complex. All proteins were present at 10 μM. The gel was blotted with anti-α-actinin antibody. (G) Indirect immunofluorescence staining of cellular E-cadherin and α-actinin on membrane patches. Control membranes were fixed after sonication. Other membranes were treated with 4 M guanidine hydrochloride, blocked, incubated with the indicated proteins and fixed. (H) Membranes were treated as in (D) and (F) and subsequently incubated with 5 μM G-actin containing 10% fluorescein-labeled actin under polymerizing conditions. Membranes were fixed before immunostaining with antibodies against E-cadherin intracellular domain. Scale bar, 10 μm.
Figure 5
Figure 5. Dynamics of E-Cadherin, Catenins, and Actin at Cell-Cell Contacts
(A) Western blots of stable cell lines used in each experiment; circles and stars indicate endogenous and GFP-tagged proteins, respectively. Percent expression level of GFP-tagged protein of the total GFP-tagged and corresponding endogenous proteins is: Ecad-GFP (45%), GFP-βcat (31%), GFP-αcat (23%), GFP-actin (3%), and PAGFP-actin (3%). (B) Representative examples of photobleaching of GFP-labeled E-cadherin, β-catenin, α-catenin, actin, and microinjected rhodamine-labeled actin and photoactivation of photoactivatable-GFP labeled actin at cell-cell contacts. Arrows point to photobleached or photoactivated spots; scale bar in (B) and (C) is 10 μm. Kymographs show the evolution of the GFP intensity profile along cell-cell contacts (vertical axis), and numbers indicate time in minutes after photobleaching or photoactivation (horizontal axis). The fluorescence intensity scale is pseudocolored. (C) Saponin-permeabilized cells were incubated with FITC-labeled actin, then fixed and stained with Alexa 546-phalloidin. (D) Quantification of fluorescence recovery after photobleaching (FRAP). The numbers of cells (n) quantified are: Ecad-GFP (n = 30), EcadΔC-tdDsR (n = 4), GFP-βcat (n = 28), GFP-αcat (n = 41), GFP-αcatΔC (n = 28), GFP-actin (n = 30), and Rhod-actin (n = 16). Error bars show SEM.
Figure 6
Figure 6. Fluorescence Loss in Photobleaching (FLIP) Reveals Protein Dynamics at Cell-Cell Contacts
Pre- and postbleach images and the corresponding kymographs of representative FLIP experiments with GFP-actin at cell-cell contacts ([A], top) and along stress fibers ([A], bottom), GFP-vinculin at cell-cell contacts ([B], top) and focal adhesions ([B], bottom), and Arp3-GFP at a cell-cell contact (C). Stars designate the location of the photobleaching laser spot, and lines indicate the intensity profile plotted in kymographs. The bars on kymographs show durations of photobleaching by the laser, and numbers are time in minutes. The fluorescence intensity scale is pseudocolored as shown in (C). Scale bar, 10 μm.
Figure 7
Figure 7. Mobility of E-Cadherin, α-Catenin, and Actin after Cytochalasin D or Jasplakinolide Treatment
GFP-actin localized at cell-cell contacts was photobleached before and after addition of 10 μM cytochalasin D (A) or 0.2 μM jasplakinolide (E). Arrows point to photobleached spots, and respective kymographs are shown. After addition of 10 μM cytochalasin D (B) or 0.2 μM jasplakinolide (F), cells were fixed and stained with Alexa 546 phalloidin and anti-α-catenin antibody. The postbleaching images and kymographs of E-cadherin-GFP and GFP-α-catenin at cell-cell contact are shown after addition of 10 μM cytochalasin D (C) or 0.2 μM jasplakinolide (G). Parameters for recovery kinetics are plotted in (D) for cytochalasin D and (H) for jasplakinolide. Red and blue symbols denote pre- and post-drug treatment, respectively. Numbers shown on the kymographs are time in minutes after photobleaching. The fluorescence intensity scale is pseudocolored as shown in (G). Error bars show SEM. Scale bar, 10 μm.

Comment in

References

    1. Aberle H, Butz S, Stappert J, Weissig H, Kemler R, Hoschuetzky H. Assembly of the cadherin-catenin complex in vitro with recombinant proteins. J Cell Sci. 1994;107:3655–3663. - PubMed
    1. Bek S, Kemler R. Protein kinase CKII regulates the interaction of beta-catenin with alpha-catenin and its protein stability. J Cell Sci. 2002;115:4743–4753. - PubMed
    1. Cooper JA. Effects of cytochalasin and phalloidin on actin. J Cell Biol. 1987;105:1473–1478. - PMC - PubMed
    1. Costa M, Raich W, Agbunag C, Leung B, Hardin J, Priess JR. A putative catenin-cadherin system mediates morphogenesis of the Caenorhabditis elegans embryo. J Cell Biol. 1998;141:297–308. - PMC - PubMed
    1. Cramer LP. Role of actin-filament disassembly in lamellipodium protrusion in motile cells revealed using the drug jasplakinolide. Curr Biol. 1999;9:1095–1105. - PubMed

Publication types

MeSH terms