. 2006 Feb 15;90(4):1295-307.
doi: 10.1529/biophysj.105.068429. Epub 2005 Dec 2.

Force generation in single conventional actomyosin complexes under high dynamic load

Affiliations

Force generation in single conventional actomyosin complexes under high dynamic load

Yasuharu Takagi et al. Biophys J. .

Abstract

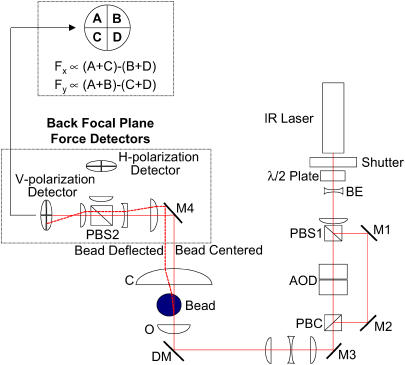
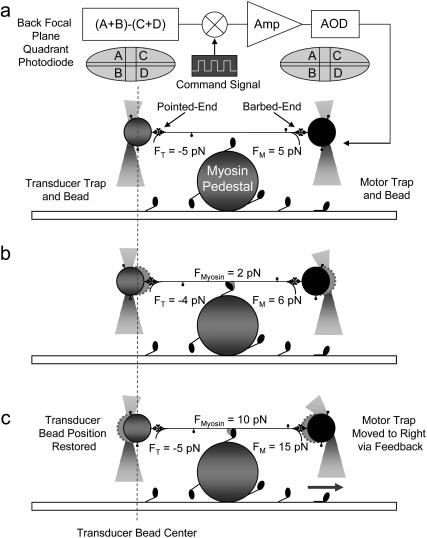
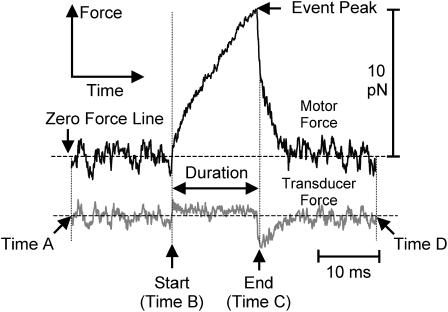
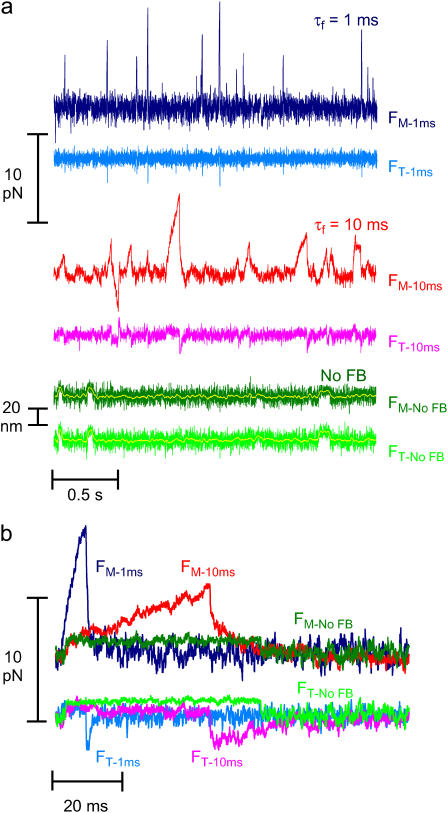
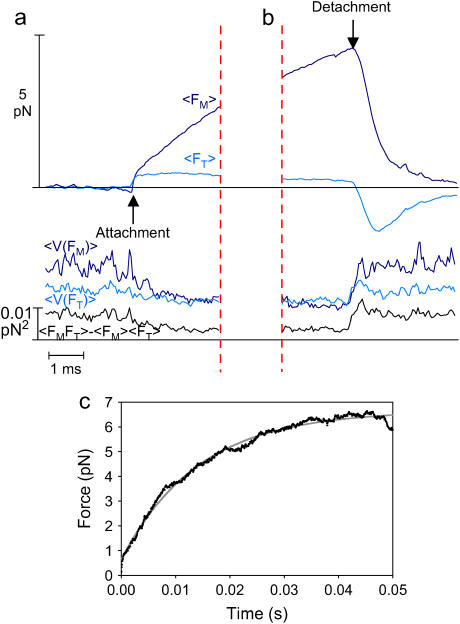
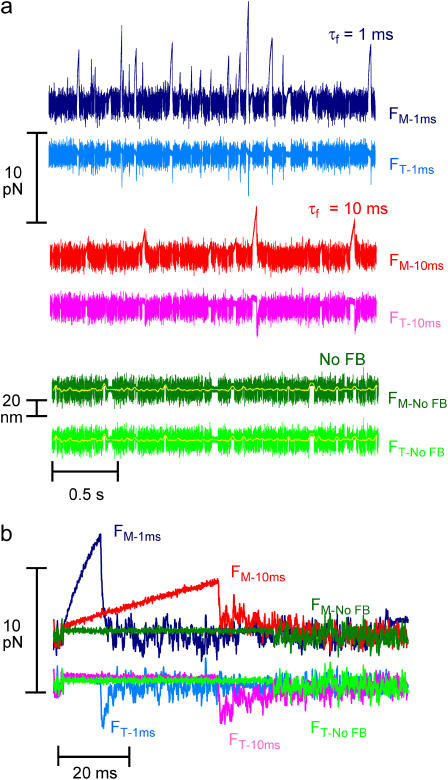
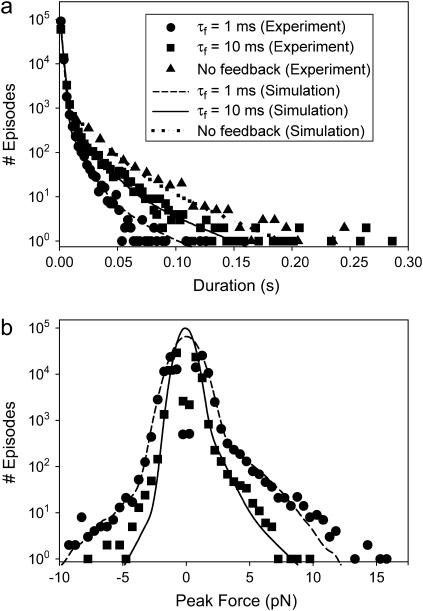
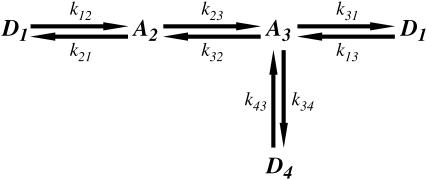
The mechanical load borne by a molecular motor affects its force, sliding distance, and its rate of energy transduction. The control of ATPase activity by the mechanical load on a muscle tunes its efficiency to the immediate task, increasing ATP hydrolysis as the power output increases at forces less than isometric (the Fenn effect) and suppressing ATP hydrolysis when the force is greater than isometric. In this work, we used a novel 'isometric' optical clamp to study the mechanics of myosin II molecules to detect the reaction steps that depend on the dynamic properties of the load. An actin filament suspended between two beads and held in separate optical traps is brought close to a surface that is sparsely coated with motor proteins on pedestals of silica beads. A feedback system increases the effective stiffness of the actin by clamping the force on one of the beads and moving the other bead electrooptically. Forces measured during actomyosin interactions are increased at higher effective stiffness. The results indicate that single myosin molecules transduce energy nearly as efficiently as whole muscle and that the mechanical control of the ATP hydrolysis rate is in part exerted by reversal of the force-generating actomyosin transition under high load without net utilization of ATP.


Figures

FIGURE 1
FIGURE 1
Optical scheme of the dual-beam optical trap. The optical tweezers setup incorporates a single FCBar Nd-YAG laser diode (λ = 1064 nm, Spectra-Physics Lasers) split into two traps with different polarizations. A two-dimensional AOD (Brimrose Corporation of America) enables rapid (∼3 μs) electronic control of the horizontally polarized trap. Force measurements of the trapped beads are collected using the BFP force detectors (44,47). These detectors are quadrant photodiodes (Current Designs, Inc.) placed at a plane optically conjugate to the BFP of the condenser. The intensity distribution at the quadrant detectors indicates the deflection of the bead relative to the center of the trap and, therefore, proportional to the applied force. Only the vertical polarization (i.e., the motor trap) of the two beams is shown for simplicity on this diagram after PBC. Abbreviations are: M, mirror; DM, dichroic mirror; PBS, polarization beam splitter; PBC, polarization beam combiner; BE, beam expander; O, objective; C, condenser; λ/2 Plate, half-wave plate.
FIGURE 2
FIGURE 2
Step-by-step motion of the isometric clamp. The sequential mechanism of the isometric force clamp with and without an actomyosin attachment can be summarized as follows. Without an actomyosin attachment, as in panel a, the clamp is stable so that the average laser forces on the two beads are equal and opposite. Even without an actomyosin attachment, the clamp responds to Brownian motions by reducing the fluctuations of the transducer bead while increasing the fluctuations of the motor bead. When myosin attaches and undergoes a power stroke, as in panel b, the actin and both beads immediately move toward the pointed end, decreasing the tension between the myosin and the transducer bead and increasing it between the myosin and the motor bead. As an example, the force produced by the myosin is shown as 2 pN in panel b. The amplified integral of the error signal from the transducer detector moves the motor trap to the right, further increasing the tension on the motor bead such that the transducer bead is returned toward its preattachment position, as shown in panel c. When the feedback loop settles, the transducer bead is returned to its preattachment position returning the actin, and therefore the myosin too, to its prepower stroke position. The measurement of the motor bead force (15 pN) is therefore equal to the exact force exerted by the myosin (10 pN) plus the pre-tension (5 pN), which can be subtracted from the measurement since this offset applied to the actin filament is known from the calibration process. Returning the actin to its preattachment position restores the myosin to its isometric condition while effectively eliminating the end compliance at the transducer bead/actin interface. When the myosin detaches, the actin and both beads move rapidly to the right. The amplified negative error signal from the transducer causes the motor trap to move left, decreasing the force on the motor bead and returning it to the state shown in panel a. The darker circles show the current bead position, and the lighter circles with a dashed circumference show the previous bead positions.
FIGURE 3
FIGURE 3
Expanded view of a single actomyosin interaction (τf = 1 ms; 10 μM ATP). Force and duration of unitary actomyosin interactions are detected using a zero crossing analysis method. Positive force episodes are defined as the period when the force trace is above zero, and negative episodes as those that are below zero, for more than 1 ms. Each positive episode starts at a negative-to-positive zero crossing of the force on the motor bead (B). The peak of the episode is determined by fitting a quadratic curve to five consecutive data points. After the force peak the force rapidly declines. The time between the start (B) and the point at which the rate of force decline is fastest (C) is defined as the duration of an episode.
FIGURE 4
FIGURE 4
Unitary actomyosin interactions under varying dynamic loads. (a) 2.5 s of raw data and (b) raw data of typical single events. Forces on motor beads (dark colors) and the transducer beads (lighter colors) during actomyosin interactions collected with the feedback gain of the isometric clamp at τf = 1 ms (blue), τf = 10 ms (red), and with the feedback turned off (green). The forces on beads for individual interactions were extracted from panel a, shown on an expanded timescale. Data collected with 10 μM ATP.
FIGURE 5
FIGURE 5
Synchronized events for τf = 1 ms, (a) beginnings and (b) ends of events including all events longer than 5 ms. (c) Synchronized beginnings of events longer than 50 ms. The average forces and variances on the motor bead (dark blue) and transducer bead (light blue) from individual events that are longer than 5 ms synchronized at the start (a, first zero crossing) and end (b, most negative slope before its subsequent zero crossing) of an interaction (τf = 1 ms and 10 μM ATP). The black trace is the covariance of the motor and transducer bead. Both variances and covariance decrease at the time of attachment and increase at the time of detachment, representing the change in stiffness accompanying actomyosin interactions. (c) Events longer than 50 ms were synchronized to determine the apparent rise time of events under high dynamic load.
FIGURE 6
FIGURE 6
(a) Duration and (b) peak force histograms compiled using experimental data of unitary actomyosin interaction under varying dynamic loads. Histograms are compiled using the data analyzed by the zero crossing analysis. The histogram of actomyosin interactions (solid symbols) is plotted together with the histogram compiled using data collected away from pedestals (in the absence of myosin), which represent the Brownian fluctuations (open symbols). (a) The curve-fit for the duration histogram for actomyosin events was calculated by adding two exponential curves—the first representing the Brownian noise and the second the probable actomyosin events limited by a single rate-limiting step. (b) The peak force histogram for actomyosin events appeared to have a merged Gaussian and exponential profile. The initial part (i.e., lower forces) of the peak force histogram was curve fit by two Gaussian curves. A narrow Gaussian curve, which accounts for the 1-ms duration threshold for episodes, was subtracted from a broader Gaussian curve, which accounts for the Brownian noise, both centered about zero. The higher peak forces of the histogram were modeled with an exponential curve, assuming that the myosin detachment is limited by a single rate-limiting step.
FIGURE 7
FIGURE 7
Theoretical Markov simulation of unitary actomyosin interactions under varying dynamic loads. (a) 2.5 s of simulated events and (b) typical single simulated events. A time sequence of randomly occurring actomyosin events under varying dynamic load was generated with a Monte Carlo simulation using the model in the Appendix and was plotted as in Fig. 4. Similarly, forces on motor beads (dark colors) and the transducer beads (lighter colors) during actomyosin interactions simulated with the feedback gain of the isometric clamp at τf = 1 ms (blue), τf = 10 ms (red), and with the feedback turned off (green). The forces on beads for individual interactions were extracted from panel a and shown on an expanded timescale.
FIGURE 8
FIGURE 8
Simulated (a) duration and (b) peak force distributions at two different feedback gains and no feedback using load-dependent k21 and k23. The differential equations included in the Appendix were solved numerically to determine the probability distribution of events for a load-dependent model.
SCHEME 1
SCHEME 1
Minimal kinetic scheme for numerical model. The models were based on variations of a general scheme with detached states (D1 and D4) and two attached force-producing states (A2 and A3), whereby the first attached state, A2, is a short-lived intermediate and the sequential state, A3, is a longer-lived state, for example at low [ATP].

References

    1. Knight, A. E., C. Veigel, C. Chambers, and J. E. Molloy. 2001. Analysis of single-molecule mechanical recordings: application to acto-myosin interactions. Prog. Biophys. Mol. Biol. 77:45–72. - PubMed
    1. Tyska, M. J., and D. M. Warshaw. 2002. The myosin power stroke. Cell Motil. Cytoskeleton. 51:1–15. - PubMed
    1. Finer, J. T., R. M. Simmons, and J. A. Spudich. 1994. Single myosin molecule mechanics: piconewton forces and nanometre steps. Nature. 386:113–119. - PubMed
    1. Molloy, J. E., J. E. Burns, J. Kendrick-Jones, R. T. Tregear, and D. C. S. White. 1995. Movement and force produced by single myosin head. Nature. 378:209–212. - PubMed
    1. Guilford, W. H., D. E. Dupuis, G. Kennedy, J. Wu, J. B. Patlak, and D. M. Warshaw. 1997. Smooth muscle and skeletal muscle myosins produce similar forces and displacements in the laser trap. Biophys. J. 72:1006–1021. - PMC - PubMed

Publication types

LinkOut - more resources