. 2006 Apr 1;395(1):107-15.
doi: 10.1042/BJ20051525.

Mechanistic characterization of the MSDH (methylmalonate semialdehyde dehydrogenase) from Bacillus subtilis

Affiliations

Mechanistic characterization of the MSDH (methylmalonate semialdehyde dehydrogenase) from Bacillus subtilis

Claire Stines-Chaumeil et al. Biochem J. .

Abstract

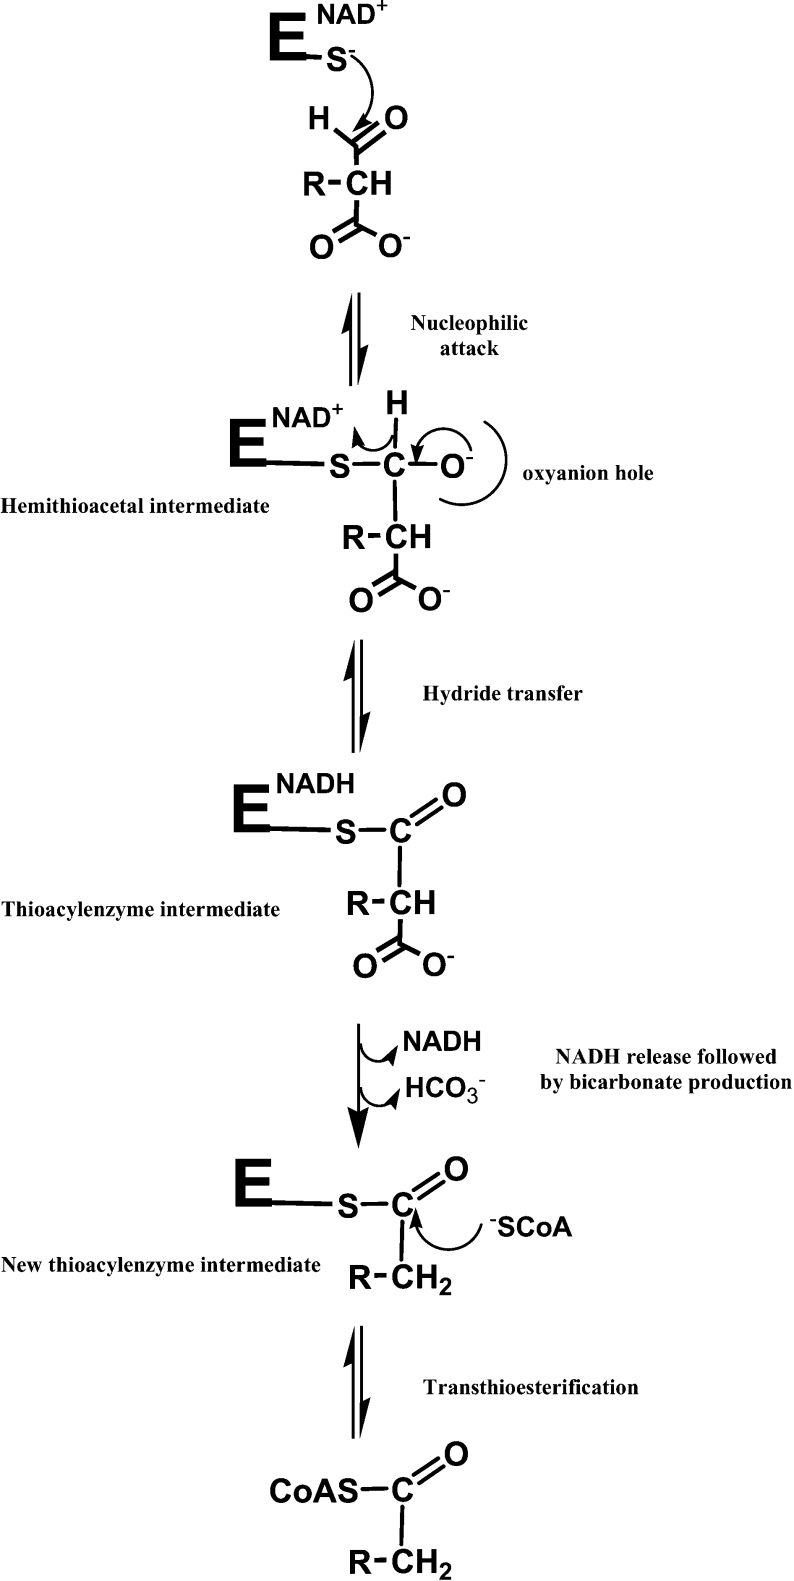
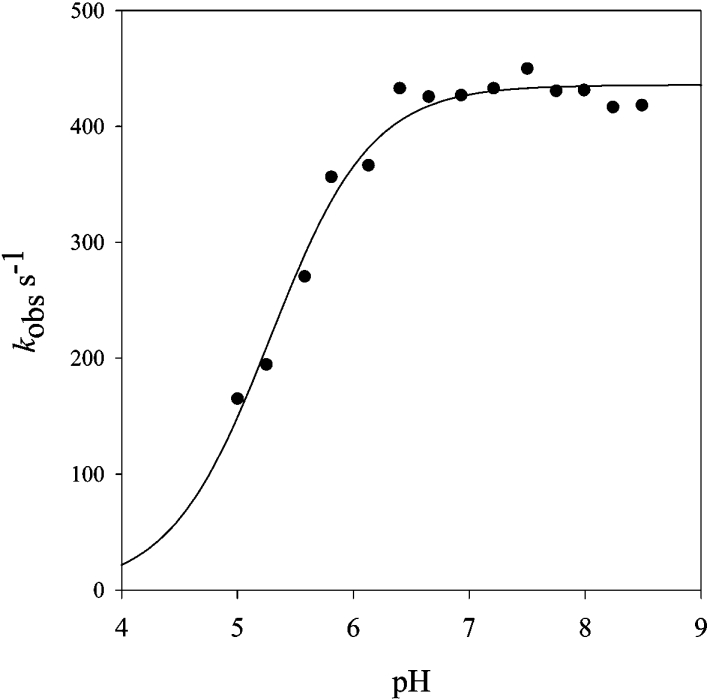
Homotetrameric MSDH (methylmalonate semialdehyde dehydrogenase) from Bacillus subtilis catalyses the NAD-dependent oxidation of MMSA (methylmalonate semialdehyde) and MSA (malonate semialdehyde) into PPCoA (propionyl-CoA) and acetyl-CoA respectively via a two-step mechanism. In the present study, a detailed mechanistic characterization of the MSDH-catalysed reaction has been carried out. The results suggest that NAD binding elicits a structural imprinting of the apoenzyme, which explains the marked lag-phase observed in the activity assay. The enzyme also exhibits a half-of-the-sites reactivity, with two subunits being active per tetramer. This result correlates well with the presence of two populations of catalytic Cys302 in both the apo- and holo-enzymes. Binding of NAD causes a decrease in reactivity of the two Cys302 residues belonging to the two active subunits and a pKapp shift from approx. 8.8 to 8.0. A study of the rate of acylation as a function of pH revealed a decrease in the pKapp of the two active Cys302 residues to approx. 5.5. Taken to-gether, these results support a sequential Cys302 activation process with a pKapp shift from approx. 8.8 in the apo-form to 8.0 in the binary complex and finally to approx. 5.5 in the ternary complex. The rate-limiting step is associated with the b-decarboxylation process which occurs on the thioacylenzyme intermediate after NADH release and before transthioesterification. These data also indicate that bicarbonate, the formation of which is enzyme-catalysed, is the end-product of the reaction.


Figures

Scheme 1
Scheme 1. Schematic representation of the catalytic mechanism of non-phosphorylating ALDHs
Scheme 2
Scheme 2. Schematic representation of MSDH-catalysed reactions as proposed from kinetic studies (see the Results and Discussion sections)
R represents a CH3 group in MMSA and PPCoA, whereas it represents a hydrogen atom in MSA and acetyl-CoA.
Figure 1
Figure 1. Progress curves for enzymatic turnover of wild-type MSDH from B. subtilis
Assays were performed at 30 °C under the following conditions: 50 mM potassium phosphate buffer (pH 8.2), 2 mM NAD, 500 μM MMSA and 500 μM CoA. In curve A, the reaction was initiated by adding 0.125 μM apo-MSDH and the steady-state rate was attained after approx. 5 min (solid line). In curve B, the enzyme pre-incubated for 20 min in the presence of 2 mM NAD was added to the complete assay to initiate the reaction.
Figure 2
Figure 2. Time-course of the MSDH fluorescence change induced by NAD-binding
Fluorescence quenching was recorded after addition of 2 mM NAD to 1.25 μM wild-type (WT) and W468F MSDHs dissolved in 50 mM potassium phosphate buffer, pH 8.2 at 30 °C. The inset details the fluorescence quenching recorded for the W28F, W76F, W177F and W397F MSDHs under the same experimental conditions. Excitation and emission wavelengths were 297 and 335 nm respectively. The raw fluorescence quenching data were converted into relative fluorescence intensities using the fluorescence intensity of the apo-forms as a reference.
Figure 3
Figure 3. Effect of NAD concentration on the rate of the apo→holo transition
Apo-(wild-type) MSDH (1.25 μM) was incubated in the presence of NAD (0.25–5 mM) in 50 mM potassium phosphate buffer, pH 8.2 at 30 °C. The time-course of the MSDH fluorescence change induced by NAD-binding was then recorded at 335 nm. At each NAD concentration a kobs value was calculated by fitting the slow additional fluorescence quenching to a mono-exponential equation. Data were fitted to eqn (1) demonstrating a Kapp of 0.38±0.08 mM and a kobs max of 0.18±0.01 min−1.
Figure 4
Figure 4. pH-dependence of the second-order-rate constant k2 for the reaction of Cys302 with 2PDS on QCys MSDH
Kinetic studies were performed over a pH range of 5.5–9.0 or 6.0–9.0 in buffer A at 30 °C. The MSDH concentration was 1.55 μM and 2PDS was 20- or 30-fold in excess relative to the free-SH concentration. Experimental data were analysed as described by Marchal and Branlant [8]. (A) Transients obtained on the apo-form were best described by a double exponential expression reflecting the contribution of two populations of non-equivalent Cys302 present in equal concentrations (at pH≤6.5, only one population was observed). Both data sets were fitted against a one-pKa model, which gave a pKapp of approx. 8.7 but different k2 values of 1.4×10⁵ M−1·s−1 (●) and 1.8×10⁴ M−1·s−1 (◆) respectively. (B) As described for the apo-form, two populations of Cys302 were also characterized in the holo-form. Data sets were fitted against a one-pKa model, which gave k2 and pKapp values of 77 M−1·s−1 and 7.90 (■), and 5.1×10⁴ M−1·s−1 and 8.60 (▲) respectively. As described above, the two Cys302 populations were not distinguishable at pH≤6.5. Thus the k2 value of approx. 20 M−1·s−1 exhibited by the ‘activated’ Cys302 (■) at pH≤6.5 reflects the contribution of the ‘non-activated’ population (▲) (k2 approx. 130 M−1·s−1 at pH 6.0). Therefore the pKapp value of 7.9 is slightly overestimated.
Figure 5
Figure 5. Burst kinetics for the MSDH-catalysed reaction
The experiment was carried out under pre-steady-state conditions in 50 mM potassium phos-phate buffer (pH 8.2) at 30 °C and in the absence of CoA. Under these experimental conditions, accumulation of the thioacylenzyme is observed due to the very low steady-state rate, 10−3·s−1. After mixing, the reaction contained 2 mM NAD, 500 μM MMSA and 4 μM (curve A) or 8 μM (curve B) of ‘activated’-MSDH. The burst of NADH production was monitered at 340 nm. The extrapolated intercept from the steady-state rate portion corresponds to a burst of 0.5 mol of NADH/mol of MSDH monomer.
Figure 6
Figure 6. Representative pH-dependence of the acylation rate constant kac for the wild-type MSDH-catalysed reaction
Pre-steady-state data were collected at 10 °C on a SX18MV-R stopped-flow apparatus (Applied PhotoPhysics) using the 5 μl cell, by rapidly mixing 4 μM wild-type MSDH, 2 mM NAD and 10 mM MMSA (final concentrations) over a pH-range of 5–8.5 in buffer A. At pHs lower than 5, MSDH was not stable. NADH appearance was monitored at 340 nm and experimental data (●) were best fitted by non-linear regression analysis against a one-pKa model, identified by the best-fit theoretical curve (solid line).
Figure 7
Figure 7. Representative transient for the determination of (A) the NADH dissociation rate and (B) the decarboxylation rate from the wild-type thioacylenzyme intermediate with MMSA as substrate
(A) A solution of 7.5 μM LDH, 20 mM pyruvate and 1 mM MMSA was rapidly mixed with an equal volume of 7.5 μM ‘activated’-MSDH and 4 mM NAD. Both syringes contained 50 mM potassium phosphate buffer, pH 8.2. Under the same experimental conditions, the rate of oxidation of free NADH by LDH was shown to be 130 s−1. Data collected were best fitted to a triphasic expression using the Origin 7 software (Microcal), as shown by the lack of systematic deviation in the plot of residuals (lower panel). The first phase represents the acylation step, the second one the NADH consumption after its release from the thioacylenzyme–NADH complex and the third one could be due to the reverse LDH-catalysed reaction. The rate constants obtained for the global fitting are 72±1 s−1, 56±1 s−1, and (3.00±0.07)×10−2 s−1 respectively. (B) The rate of the decarboxylation process was determinated at 30 °C from the thioacylenzyme intermediate by using the PEP/PEPC/MDH system as a coupled assay. Experimental conditions are described in detail in the Experimental section. Data collected using a split time-base (2000 points for the first 100 ms, and 2000 points for the remaining 10 s) were best fitted to a triphasic expression using the Origin 7 software as shown by the lack of systematic deviation in the plot of residuals (lower panel). The first phase represents the acylation step, the second one the bicarbonate release and the third one could be due to the reverse MDH-catalysed reaction. The rate constants obtained for the global fitting are 415±5 s−1, 2.5±0.1 s−1, and (1.00±0.01)×10−3 s−1 respectively.

References

    1. Liu Z. J., Sun Y. J., Rose J., Chung Y. J., Hsiao C. D., Chang W. R., Kuo I., Perozich J., Lindahl R., Hempel J., Wang B. C. The first structure of an aldehyde dehydrogenase reveals novel interactions between NAD and the Rossmann fold. Nat. Struct. Biol. 1997;4:317–326. - PubMed
    1. Steinmetz C. G., Xie P., Weiner H., Hurley T. D. Structure of mitochondrial aldehyde dehydrogenase: the genetic component of ethanol aversion. Structure. 1997;5:701–711. - PubMed
    1. Cobessi D., Tete-Favier F., Marchal S., Azza S., Branlant G., Aubry A. Apo and holo crystal structures of an NADP-dependent aldehyde dehydrogenase from Streptococcus mutans. J. Mol. Biol. 1999;290:161–173. - PubMed
    1. Farres J., Wang T. T., Cunningham S. J., Weiner H. Investigation of the active site cysteine residue of rat liver mitochondrial aldehyde dehydrogenase by site-directed mutagenesis. Biochemistry. 1995;34:2592–2598. - PubMed
    1. Vedadi M., Szittner R., Smillie L., Meighen E. Involvement of cysteine 289 in the catalytic activity of an NADP+-specific fatty aldehyde dehydrogenase from Vibrio harveyi. Biochemistry. 1995;34:16725–16732. - PubMed

Publication types

LinkOut - more resources