. 2005 Dec;71(12):8273-83.
doi: 10.1128/AEM.71.12.8273-8283.2005.

Timing of induction of osmotically controlled genes in Salmonella enterica Serovar Typhimurium, determined with quantitative real-time reverse transcription-PCR

Affiliations

Timing of induction of osmotically controlled genes in Salmonella enterica Serovar Typhimurium, determined with quantitative real-time reverse transcription-PCR

Boovaraghan Balaji et al. Appl Environ Microbiol. 2005 Dec.

Abstract

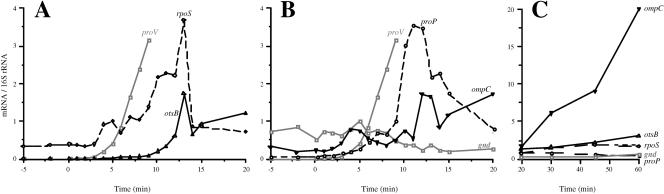
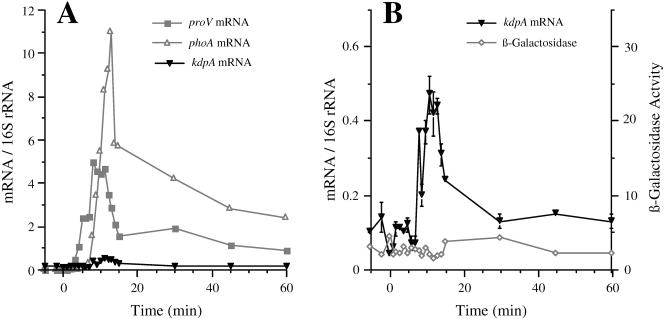
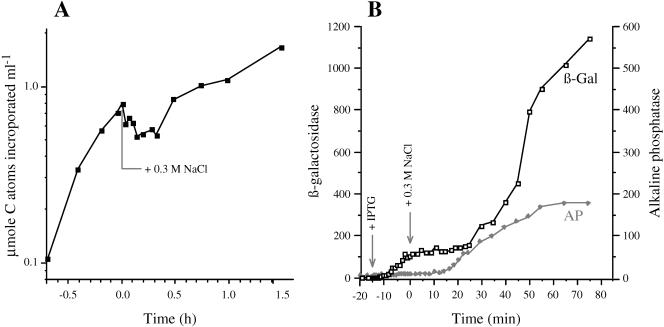
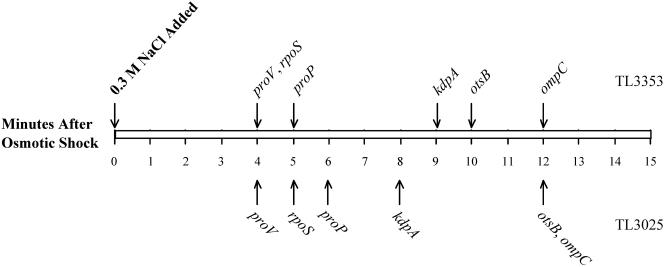
The signals that control the transcription of osmoregulated genes are not understood satisfactorily. The "turgor control model" suggested that the primary osmoregulatory signal in Enterobacteriaceae is turgor loss, which induces the kdp K+ transport operon and activates the Trk K+ permease. The ensuing increase in cytoplasmic K+ concentration was proposed to be the signal that turns on all secondary responses, including the induction of the proU (proline-glycine betaine transport) operon. The "ionic strength model" proposed that the regulatory signal for all osmotically controlled responses is the increase in the cytoplasmic ionic strength or macromolecular crowding after an osmotic upshift. The assumption in the turgor control model that the induction of kdp is a primary response to osmotic shock predicts that this response should precede all secondary responses. Both models predict that the induction of all osmotically activated responses should be independent of the chemical nature of the solute used to impose osmotic stress. We tested these predictions by quantitative real-time reverse transcription-PCR analysis of the expression of six osmotically regulated genes in Salmonella enterica serovar Typhimurium. After shock with 0.3 M NaCl, proU was induced at 4 min, proP and rpoS were induced at 4 to 6 min, kdp was induced at 8 to 9 min, and otsB and ompC were induced at 10 to 12 min. After an equivalent osmotic shock with 0.6 M sucrose, proU was induced with kinetics similar to those seen with NaCl, but induction of kdp was reduced 150-fold in comparison to induction by NaCl. Our results are inconsistent with both the turgor control and the ionic strength control models.


Figures

FIG. 1.
FIG. 1.
The location of the amplified segments of the proU and kdp mRNAs in the strains used for the Q-RT-PCR analysis of the osmotic control of proU and kdp expression. The arrows indicate the distance from the promoters to the amplified regions in the mRNAs.
FIG. 2.
FIG. 2.
Kinetics of induction of the proU and kdp operons by osmotic shock with 0.3 M NaCl. Strain TL3353 (kdp+ proV+ proW+ proX-phoA/proV+pro W+ proX-lacZ) was grown in K medium and shocked with 0.3 M NaCl at 0 min. The accumulation of the kdpA, proV, phoA, and lacZ mRNAs was determined by Q-RT-PCR. The synthesis of alkaline phosphatase and β-galactosidase activities were measured at the indicated time points as described in Materials and Methods. The mRNA levels are normalized to the level of 16S rRNA, and the enzyme activities are in nanomoles of substrate consumed per minute per milligram of protein. (A and B) Normalized mRNA levels displayed for the first 15 min (A) and for 60 min (B); panel A shows an expanded version of the same data as panel B. For the sake of clarity, the mRNA data for kdpA and lacZ are plotted on different scales than for proV and phoA; the normalized mRNA levels were multiplied by 2 for kdpA and by 10 for lacZ. (C) Alkaline phosphatase and β-galactosidase specific activities. The levels of the phoA and lacZ mRNAs from panel B are also included in this panel. The threshold times of induction and times of peak expression were determined by ANOVA, as described in Materials and Methods. The threshold induction times of proV and kdpA were at 4 and 9 min, respectively (P < 0.0001). Mean peak value expression of proV was at 14 min (t = 17.3) and of kdpA was at 20 min 20 min (t = 15.5) (P < 0.0001 for both).
FIG. 3.
FIG. 3.
The kinetics of induction of the rpoS, otsB, proP, and ompC genes after shock with 0.3 M NaCl. RNA preparations isolated in the experiment shown in Fig. 2 were used to measure the expression of the rpoS, otsB, proP, and ompC genes at the indicated time points as described in Materials and Methods. (A) Normalized mRNA levels for the rpoS and otsB genes; (B) data for the proP, ompC and gnd genes for the first 20 min after the shock with 0.3 M NaCl. These panels also include the results for the proV gene, copied from Fig. 2. (C) Data for the rpoS, otsB, proP, ompC, and gnd genes for the 20 to 60 min after the osmotic shock.
FIG. 4.
FIG. 4.
The kinetics of induction of the kdp and proU operons after shock with 0.6 M sucrose. Strain TL3025 (kdp+ proX-phoA/kdpA-lacZ) was grown in K medium and exposed to an osmotic shock with 0.6 M sucrose. At the indicated time points, the accumulation of the kdpA, proV, and phoA mRNAs was determined by Q-RT-PCR and the synthesis of alkaline phosphatase and β-galactosidase activities measured as described in Materials and Methods. (A) Normalized kdpA, proV, and phoA mRNA levels. (B) Expanded view of the normalized mRNA levels for the kdpA mRNA and the β-galactosidase activities (in nanomoles per minute per milligram of protein). The induction of alkaline phosphatase from the proX-phoA fusion was also determined. These data, which are not shown, were similar to those obtained with the proX-phoA fusion after shock with 0.3 M NaCl (Fig. 2).
FIG. 5.
FIG. 5.
Effect of osmotic shock on macromolecular synthesis and induction of the lac operon. (A) Strain TL3353 was grown in K medium containing 10 μCi [U-14C]glucose. At 0 h, the osmolality of the medium was increased with 0.3 M NaCl. Samples were removed from the culture at the indicated time points, and the incorporation of radioactivity into macromolecules was determined as described in Materials and Methods. (B) Strain TL3799 (kdp+ proX-phoA/F′ lac+) was grown in K medium. At −15 min, the lac operon was induced with 1 mM IPTG; at time 0, the osmolality of the culture was increased with 0.3 M NaCl. The accumulation of β-galactosidase and alkaline phosphatase (in nanomoles per minute per milligram of protein) was determined at the indicated time points, as described in Materials and Methods.
FIG. 6.
FIG. 6.
The timeline of induction of osmotically controlled genes. This figure shows the threshold induction times of the proV, kdpA, proP, rpoS, otsB, and ompC genes after shock with 0.3 M NaCl. The threshold induction times of these genes were determined by ANOVA, as described in Materials and Methods. The arrows above the rectangle show the times of induction of each gene in strain TL3353 after shock with 0.3 M NaCl, extracted from the data shown in Fig. 2 and 3, and the arrows below the rectangle show induction times obtained with strain TL3025 in a similar experiment (primary data not shown).

References

    1. Asha, H., and J. Gowrishankar. 1993. Regulation of kdp operon expression in Escherichia coli: evidence against turgor as signal for transcription control. J. Bacteriol. 175:4528 to 4537. - PMC - PubMed
    1. Balaji, B., D. B. Bucholtz, and J. M. Anderson. 2003. Barley yellow dwarf virus and cereal yellow dwarf virus quantification by real-time polymerase chain reaction in resistant and susceptible plants. Phytopathology 93:1386-1392. - PubMed
    1. Booth, I. R., and C. F. Higgins. 1990. Enteric bacteria and osmotic stress; intracellular potassium glutamate as a secondary signal of osmotic stress. FEMS Microbiol. Rev. 75:239-246. - PubMed
    1. Bremer, H., and P. P. Dennis. 1996. Modulation of chemical composition and other parameters of the cell by growth rate, p. 1553-1569. In F. C. Neidhardt, R. Curtiss III, J. L. Ingraham, E. C. C. Lin, K. B. Low, B. Magasanik, W. S. Reznikoff, M. Riley, M. Schaechter, and H. E. Umbarger (ed.), Escherichia coli and Salmonella: cellular and molecular biology, 2nd ed. American Society for Microbiology, Washington, D.C.
    1. Burg, M. B., E. D. Kwon, and D. Kültz. 1996. Osmotic regulation of gene expression. FASEB J. 10:1598-1606. - PubMed

Publication types

MeSH terms

LinkOut - more resources