. 2005 Dec;71(12):8825-35.
doi: 10.1128/AEM.71.12.8825-8835.2005.

Development and evaluation of genome-probing microarrays for monitoring lactic acid bacteria

Affiliations

Development and evaluation of genome-probing microarrays for monitoring lactic acid bacteria

Jin-Woo Bae et al. Appl Environ Microbiol. 2005 Dec.

Abstract

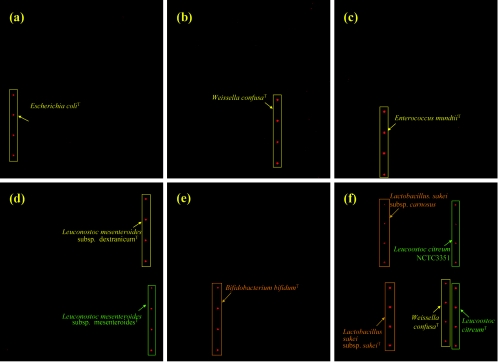
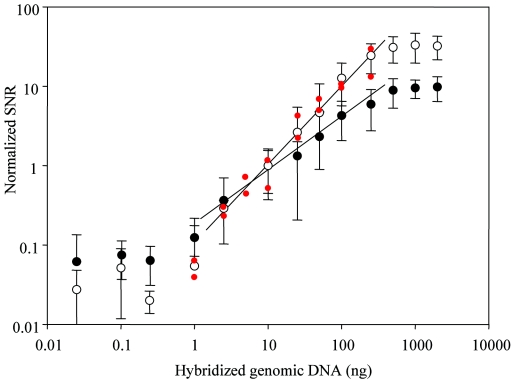
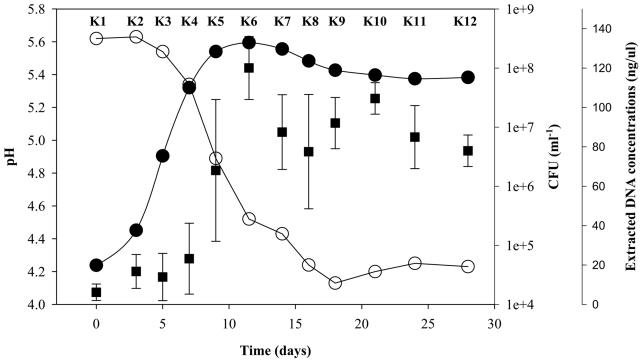
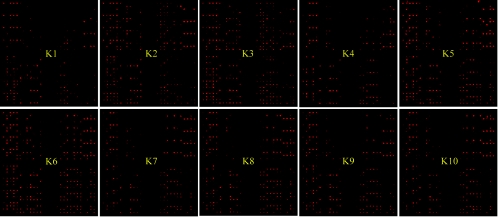
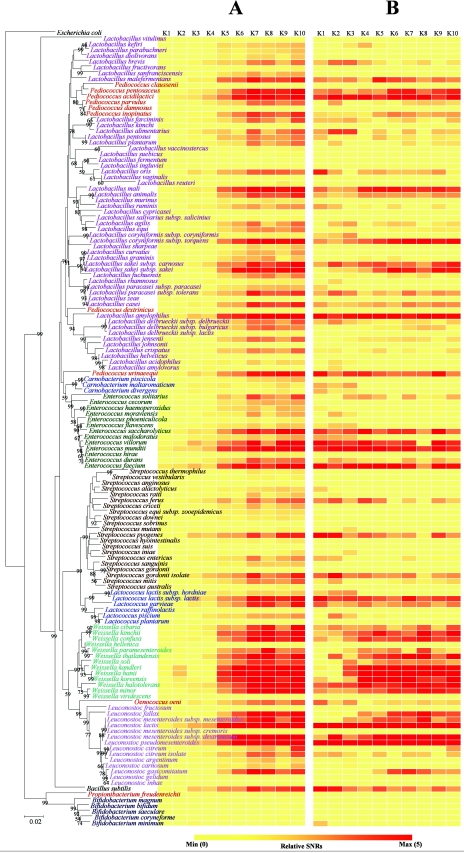
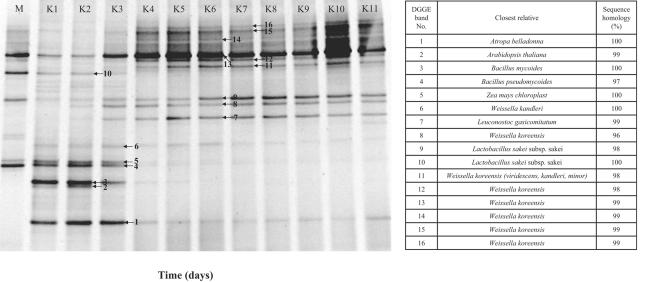
The genome-probing microarray (GPM) was developed for quantitative, high-throughput monitoring of community dynamics in lactic acid bacteria (LAB) fermentation through the deposit of 149 microbial genomes as probes on a glass slide. Compared to oligonucleotide microarrays, the specificity of GPM was remarkably increased to a species-specific level. GPM possesses about 10- to 100-fold higher sensitivity (2.5 ng of genomic DNA) than the currently used 50-mer oligonucleotide microarrays. Since signal variation between the different genomes was very low compared to that of cDNA or oligonucleotide-based microarrays, the capacity of global quantification of microbial genomes could also be observed in GPM hybridization. In order to assess the applicability of GPMs, LAB community dynamics were monitored during the fermentation of kimchi, a traditional Korean food. In this work, approximately 100 diverse LAB species could be quantitatively analyzed as actively involved in kimchi fermentation.


Figures

FIG. 1.
FIG. 1.
Fluorescence images showing hybridization specificity of GPMs. Levels of specificity obtained with 500 ng of labeled target genomes from (a) E. coli type strain, (b) W. confusa type strain, (c) E. mundtii type strain, (d) Leuconostoc mesenteroides subsp. mesenteroides type strain, (e) B. bifidum type strain, and (f) Lactobacillus sakei subsp. sakei type strain, W. confusa type strain, and Leuconostoc citreum type strain. Target genomes are marked with squares and arrows. T, type strain.
FIG. 2.
FIG. 2.
Evaluation of the quantitative potential of GPM-based hybridization with genomic DNAs from W. confusa type strain and E. mundtii type strain. The log ratios of hybridization signals (normalized SNR) between the target genome and spiked control genomic DNA from E. coli type strain were calculated and plotted against the log of the concentrations of the genomic DNA. Slides were scanned using different PMT gain settings: 700 V (○) and 900 V (•). Quantitative capacity of GPMs was also investigated with mixtures of DNAs from 16 different, arbitrarily selected bacteria with different concentrations at a PMT gain of 700 V (red dots): 1 ng (each) of Enterococcus hemoperoxidus and Weissella kimchii, 2.5 ng (each) of Lactobacillus casei and O. oeni, 5 ng (each) of Streptococcus vestibularis and P. acidilactici, 10 ng (each) of Lactobacillus delbrueckii subsp. delbrueckii and Lactobacillus sakei subsp. sakei, 25 ng (each) of Leuconostoc mesenteroides subsp. mesenteroides and Propionibacterium freudenreichii subsp. freudenreichii, 100 ng (each) of Lactobacillus brevis and Bifidobacterium minimum, and 250 ng (each) of Lactobacillus plantarum and Streptococcus gordonii (the pairs are ordered such that the organism with the higher signal is listed first).
FIG. 3.
FIG. 3.
LAB growth (filled circles) and pH change (open circles) during kimchi fermentation. Each point of the total LAB counts and pH is the mean of three samplings. The concentration of bulk community DNA (filled squares) extracted from each sample was also plotted. Standard deviations are shown with error bars. Kimchi samples were named K1 to K12. Samples K1 to K10 were also used in the experiments shown Fig. 4 and 5.
FIG. 4.
FIG. 4.
Representative fluorescence images showing GPM hybridization with kimchi samples (K1 to K10). The contrast of each image was automatically modulated with GenePix software to be more recognizable with the naked eye.
FIG.5.
FIG.5.
Quantities of LAB in kimchi samples detected with GPMs at a PMT gain of 700 V. Microarray hybridization patterns with the labeled genomic DNAs from kimchi (samples K1 to K10) are shown in each column. Each row represents the hybridization signal observed for each LAB when 1 μg of genomic DNA from the kimchi (see column) was used for hybridization. The SNRs from 12 replicates were then averaged to represent the SNR for a particular probe. Normalized and relative SNRs were visualized by ArrayColor.exe (http://microarray.kaist.ac.kr), which produces more yellow squares from lower values of normalized/relative SNRs and more red squares from higher values. (A) Normalized SNR values of LAB in 1 μg of bulk community DNA extracted from each phase of kimchi fermentation. For global normalization, normalized SNRs were obtained by dividing the SNR value from each spot by the SNR of 10 ng of spiked E. coli genomic DNA on the same experimental slide. (B) Relative SNRs obtained by dividing the normalized SNR by the mean value of the normalized SNR in the same kimchi samples. A phylogenetic tree indicating the relationships of LAB was harmonized manually with the two SNR pictures. For NCBI numbers of LAB 16S rRNA used in the phylogenetic tree, see Table S1 in the supplemental material.
FIG. 6.
FIG. 6.
DGGE profiles of PCR-amplified 16S rDNA segments from periodically sampled kimchi (samples K1 to K10).

References

    1. Ampe, F., A. Sirvent, and N. Zakhia. 2001. Dynamics of the microbial community responsible for traditional sour cassava starch fermentation studied by denaturing gradient gel electrophoresis and quantitative rRNA hybridization. Int. J. Food Microbiol. 65:45-54. - PubMed
    1. Becker, S., P. Boger, R. Oehlmann, and A. Ernst. 2000. PCR bias in ecological analysis: a case study for quantitative Taq nuclease assays in analyses of microbial communities. Appl. Environ. Microbiol. 66:4945-4953. - PMC - PubMed
    1. ben Omar, N., and F. Ampe. 2000. Microbial community dynamics during production of the Mexican fermented maize dough pozol. Appl. Environ. Microbiol. 66:3664-3673. - PMC - PubMed
    1. Bodrossy, L., and A. Sessitsch. 2004. Oligonucleotide microarrays in microbial diagnostics. Curr. Opin. Microbiol. 7:245-254. - PubMed
    1. Bodrossy, L., N. Stralis-Pavese, J. C. Murrell, S. Radajewski, A. Weilharter, and A. Sessitsch. 2003. Development and validation of a diagnostic microbial microarray for methanotrophs. Environ. Microbiol. 5:566-582. - PubMed

Publication types

MeSH terms