. 2006 Jan;4(1):e5.
doi: 10.1371/journal.pbio.0040005.

Horizontal transfer of a plant transposon

Affiliations

Horizontal transfer of a plant transposon

Xianmin Diao et al. PLoS Biol. 2006 Jan.

Abstract

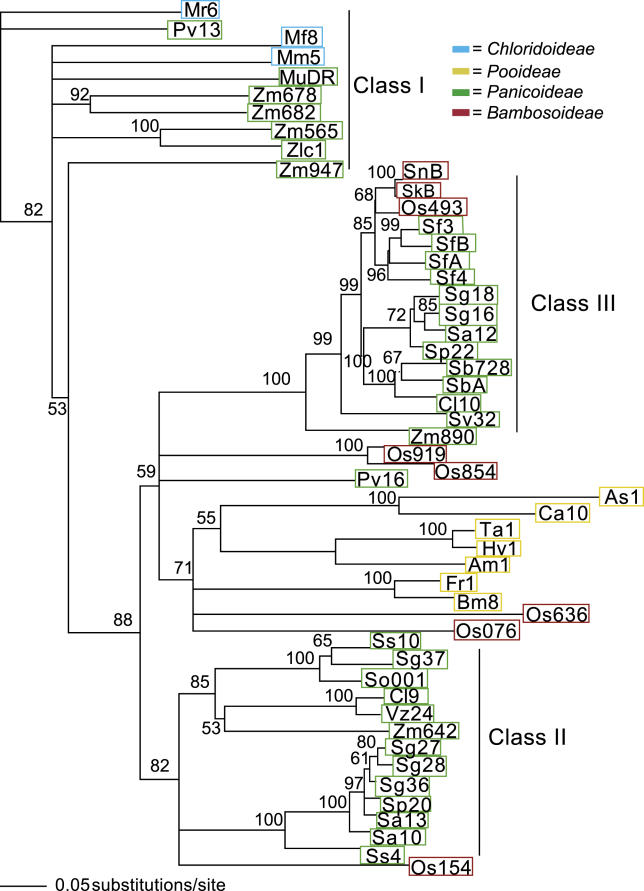
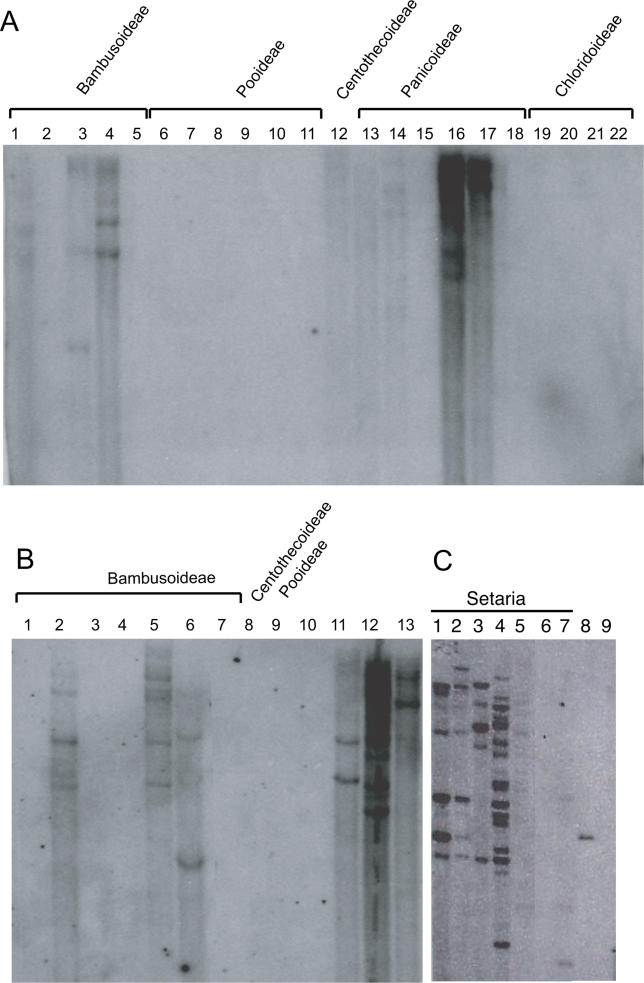
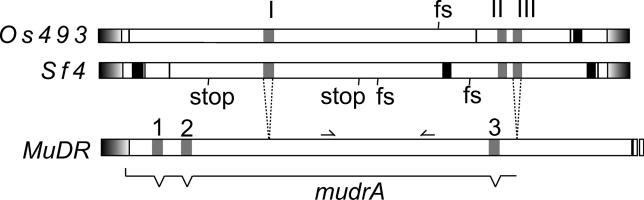
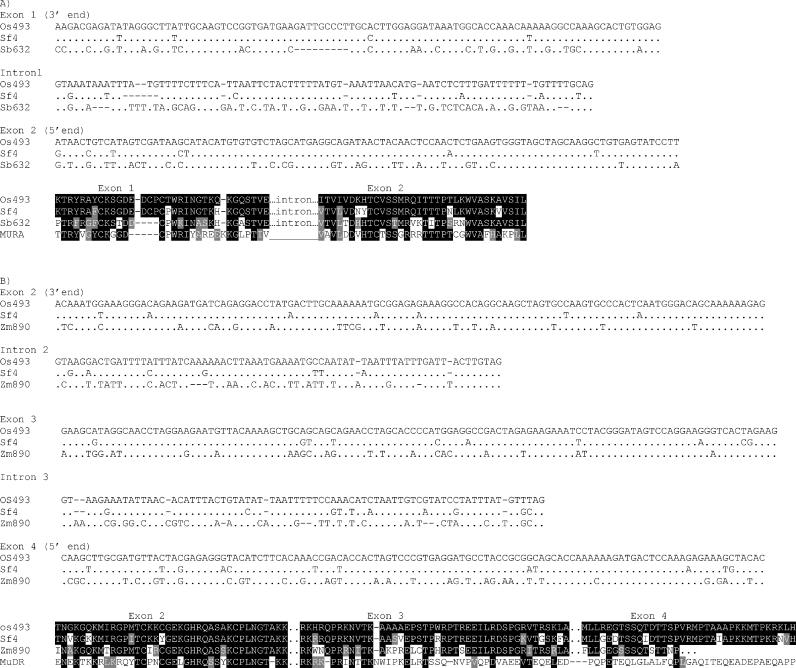
The majority of well-documented cases of horizontal transfer between higher eukaryotes involve the movement of transposable elements between animals. Surprisingly, although plant genomes often contain vast numbers of these mobile genetic elements, no evidence of horizontal transfer of a nuclear-encoded transposon between plant species has been detected to date. The most mutagenic known plant transposable element system is the Mutator system in maize. Mu-like elements (MULEs) are widespread among plants, and previous analysis has suggested that the distribution of various subgroups of MULEs is patchy, consistent with horizontal transfer. We have sequenced portions of MULE transposons from a number of species of the genus Setaria and compared them to each other and to publicly available databases. A subset of these elements is remarkably similar to a small family of MULEs in rice. A comparison of noncoding and synonymous sequences revealed that the observed similarity is not due to selection at the amino acid level. Given the amount of time separating Setaria and rice, the degree of similarity between these elements excludes the possibility of simple vertical transmission of this class of MULEs. This is the first well-documented example of horizontal transfer of any nuclear-encoded genes between higher plants.


Figures

Figure 1
Figure 1. Phylogenetic Analysis of Various mudrA-Homologous Sequences from Grasses Representative of Several Major Subfamilies of Grasses
Species designations are as follows: Zm, Zea mays (MuDR is mudrA); Zl, Zea luxurians; Sv, Setaria viridis; Sa, S. anceps; Sf, S. faberi; Ss, S. sphacelata; Sg, S. glauca; Sp, Setaria palmifolia; Sb, Sorghum bicolor; Cl, Coix lacryma; Os, O. sativa; Pv, P. virigatum; Vz, Vetevaria zizanoides; Mr, Muhlenberia rigens; Mm, Muhlenbergia macroura; So, Saccharum officinarum; Sk, Shibataea kumasaca; Sn, Sinarundinaria nitida; As, Avena sativa; Ca, Calamagrostis acutifolia; Ta, Triticum aestivum, Hv, Hordeum vulgare; Am, Ammophila arenaria; Fr, Festuca rubra; Bm, Briza maxima. Numbers represent individual clones from each species, or the last three digits of the accession number if the sequence was obtained from NCBI. Colored blocks indicate major subfamilies: green, Panicoideae; blue, Chloridoideae; yellow, Pooideae; red, Bambusoideae. Branch lengths are proportional to distance, as indicated by the scale bar. Bootstrap support is as indicated for each branch.
Figure 2
Figure 2. DNA Gel Blots of Representative Species from All Major Subfamilies of the Grasses
All blots were probed with a fragment of MULE sf3 from S. faberi. Subfamilies (i.e., Pooideae) are as indicated. (A) 1, Shibataea kumasaca; 2, Ehrharta erecta; 3, Oryza sativa indica; 4, Oryza sativa japonica; 5, Zizania latifolia; 6, Nardus stricta; 7, Diarrhena japonica; 8, Brachypodium sylvaticum; 9, Phalaris aquatica; 10, Hordeum vulgare; 11, Triticum aestivum; 12, Chasmanthium latifolium; 13, Andropogon gerardii; 14, Sorghum bicolor; 15, Tripsacum dactyloides; 16, S. faberi; 17, S. italica; 18, Zea mays; 19, Muhlenbergia rigens; 20, Eleusine indica; 21, Boutelova curtipendula; 22, Cortaderia jubata. (B) 1. Zizania latifolia; 2, Shibataea kumasaca; 3, Chusquea montana; 4, Chusquea quila; 5, Sinarundinaria nitida; 6, Phyllostachys vivax; 7, Otatea acuminata; 8, Zeigotes sp.; 9, Brachypodium sylvaticum; 10, Zizania latifolium; 11, O. sativa (japonica); 12, S. faberi; 13, S. italica. (C) 1, S. italica; 2, S. italica; 3, S. viridis; 4, S. faberi; 5, S. glauca; 6, S. anceps; 7, S. sphacelata; 8, O. sativa; 9, Zea mays.
Figure 3
Figure 3. Schematic of the MULE Elements from Rice (Os493) and Setaria faberi (Sf4)
Black blocks represent regions deleted in one or the other sequence. Grey blocks represent putative introns, which are numbered in the Setaria and rice elements with Roman numerals I–III. The second intron is collinear with the third intron in mudrA from maize. The mudrA introns are numbered 1–3. Shaded blocks on the ends of the elements indicate the terminal inverted repeats. For comparison, the 5' end of MuDR from maize (which includes the mudrA gene) is also included. Note that only the third intron of the mudrA gene and the third intron in the rice and Setaria is present in all three elements. The position of the RF2 and RR2 PCR primers are as indicated on the MuDR element. Stops and frameshifts in the Setaria and rice element (assuming introns are spliced) are at the positions indicated. Dotted lines connecting MuDR to Sf4 indicate regions of similarity.
Figure 4
Figure 4. A Comparison of Coding and Noncoding Sequences from Various MULEs
(A) An alignment of the nucleotide sequence of a portion of the first exon, the first intron, and a portion of the second exon from the rice, Setaria, and sorghum MULEs. Identical nucleotides are displayed as periods; differences are as indicated. (B) An alignment of the 3' end of exon 2, intron 2, exon 3, intron 3, and the 5' end of exon 4 from mudrA homologs from rice (Os493), S. faberi (Sf4), and a related element from maize (Zm890). In both panels, amino acid translations, shaded for similarity to Os493, are portrayed below the nucleotide alignments. MURA sequence is provided for comparison.
Figure 5
Figure 5. Bar Graph Displaying Percent Similarity of the Setaria (Sf4), Maize (Zm890), and Sorghum (Sb662) Elements with the Rice Element (Os493)
The region analyzed includes the last portion of exon 1, intron 1, portions of exon 2, intron 2, exon 3, intron 3, and the first portion of exon 4. Although percent similarity for exon 1 and intron 1 between Sf4 and Os493 is shown, the corresponding region in Zm890 is not available, nor are sequences for the last two introns of Sb662. The percent figure is the percent identity of each element in the specified region to Os493 in that region. Portions in which no sequence was available are given a 0% value. T Exon and T Intron refer to the sum of exons and introns, respectively, that were compared.

References

    1. Jain R, Rivera MC, Moore JE, Lake JA. Horizontal gene transfer in microbial genome evolution. Theor Popul Biol. 2002;61:489–495. - PubMed
    1. Doolittle WF. Phylogenetic classification and the universal tree. Science. 1999;284:2124–2129. - PubMed
    1. Syvanen M, Kado C, editors. Horizontal gene transfer. New York: Academic Press; 2002. 445 pp.
    1. Silva JC, Kidwell MG. Horizontal transfer and selection in the evolution of P elements. Mol Biol Evol. 2000;17:1542–1557. - PubMed
    1. Robertson HM, Soto-Adames FN, Walden KO, Avancini RMP, Lampe DJ. The mariner transposons of animals: Horizontally jumping genes. In: Syvanen M, Kado CI, editors. Horizontal gene transfer. New York: Chapman and Hill; 1998. pp. 268–284.

Publication types

Substances