. 2006 Jan;4(1):e2.
doi: 10.1371/journal.pbio.0040002.

Conserved and variable functions of the sigmaE stress response in related genomes

Affiliations

Conserved and variable functions of the sigmaE stress response in related genomes

Virgil A Rhodius et al. PLoS Biol. 2006 Jan.

Abstract

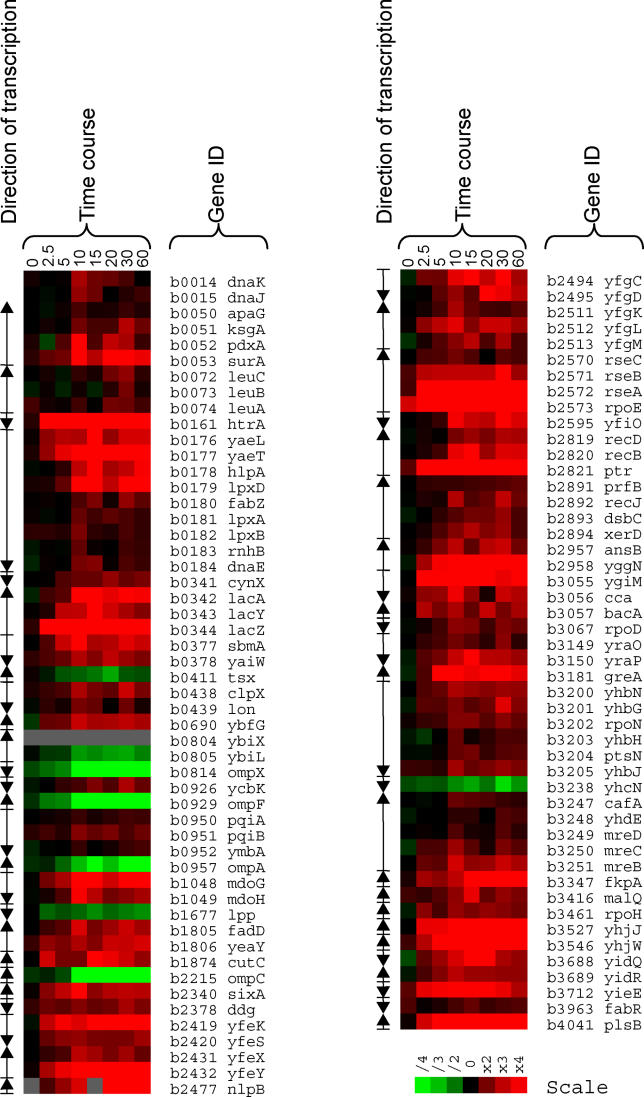
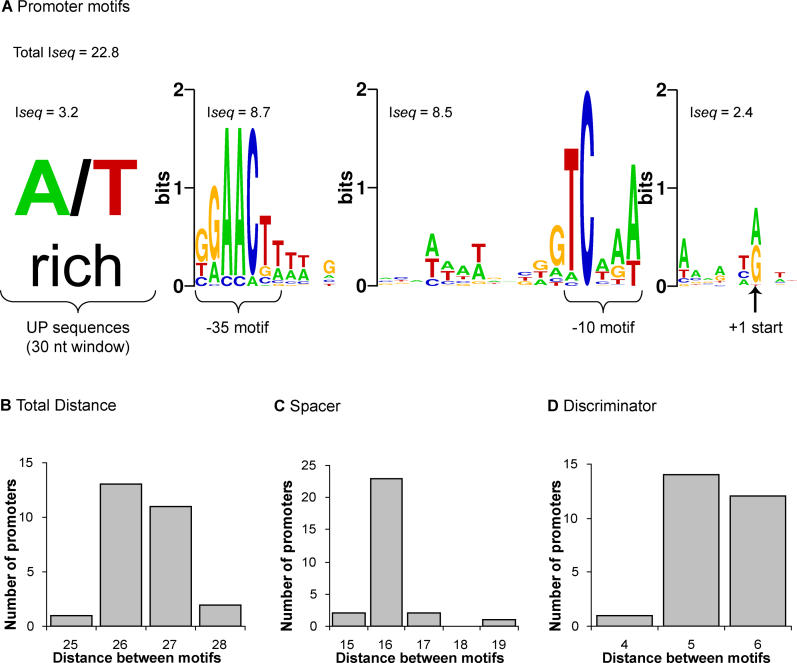
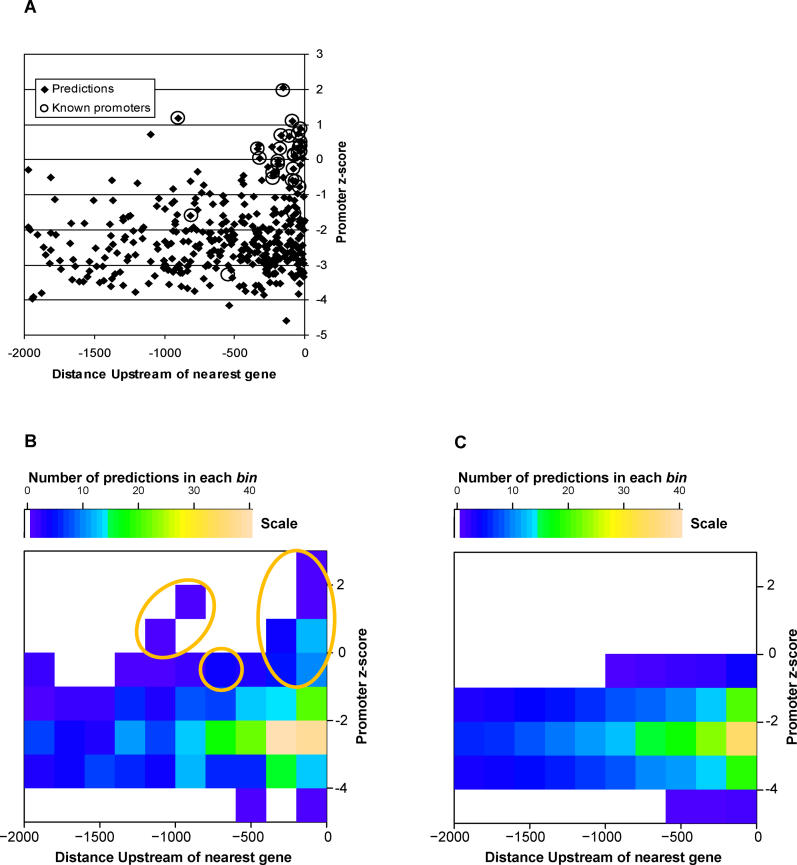
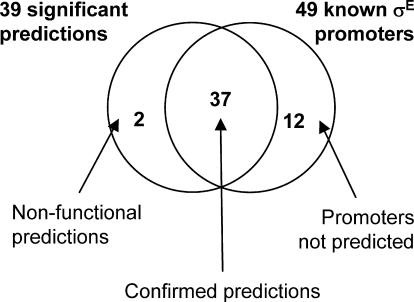
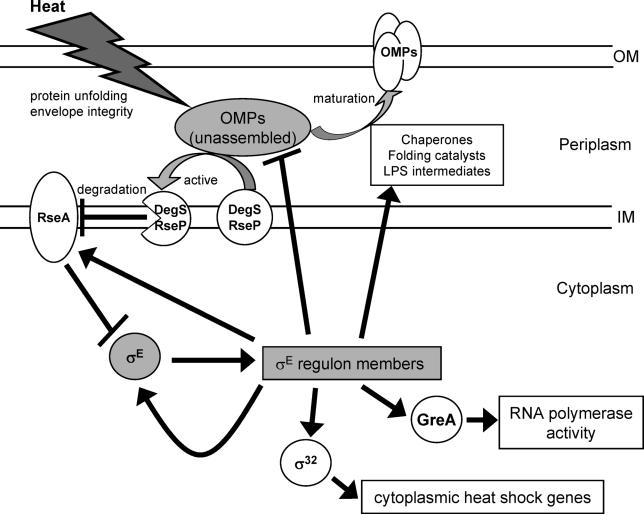
Bacteria often cope with environmental stress by inducing alternative sigma (sigma) factors, which direct RNA polymerase to specific promoters, thereby inducing a set of genes called a regulon to combat the stress. To understand the conserved and organism-specific functions of each sigma, it is necessary to be able to predict their promoters, so that their regulons can be followed across species. However, the variability of promoter sequences and motif spacing makes their prediction difficult. We developed and validated an accurate promoter prediction model for Escherichia coli sigmaE, which enabled us to predict a total of 89 unique sigmaE-controlled transcription units in E. coli K-12 and eight related genomes. SigmaE controls the envelope stress response in E. coli K-12. The portion of the regulon conserved across genomes is functionally coherent, ensuring the synthesis, assembly, and homeostasis of lipopolysaccharide and outer membrane porins, the key constituents of the outer membrane of Gram-negative bacteria. The larger variable portion is predicted to perform pathogenesis-associated functions, suggesting that sigmaE provides organism-specific functions necessary for optimal host interaction. The success of our promoter prediction model for sigmaE suggests that it will be applicable for the prediction of promoter elements for many alternative sigma factors.


Figures

Figure 1
Figure 1. Expression Profiles of σE Regulon Members
Significantly regulated genes identified from genome-wide transcription profiling following comparison of rpoE overexpressed (CAG25197) versus wild-type (CAG25196) E. coli K-12 MG1655 cells. The color chart illustrates the expression level for each gene from an average of four time-course experiments (see Materials and Methods). Red denotes induced, and green denotes repressed genes in CAG25197 following rpoE induction. Fold change of mRNA levels (rpoE overexpressed/wild-type) is indicated by the scale at the bottom of the figure; time in minutes after induction of rpoE in the time-course experiments is indicated at the top of the figure. Genes are identified by their unique ID and name (Gene ID) and are listed in chromosomal order to illustrate the TUs; the direction of transcription is indicated.
Figure 2
Figure 2. Sequence Logos and Spacer Histograms of σE Promoter Motifs
Motifs were identified upstream of the 28 mapped transcription starts in E. coli K-12. (A) Sequence logos (http://weblogo.berkeley.edu/; [78]) of the −35, −10, and +1 start site motifs and the A/T rich UP sequences. The information content (Iseq) of each motif is indicated (see Materials and Methods). (B–D) Histograms of the number of promoters versus distances between the motifs identified in (A): (B) +1 start and −35 motifs; (C) −10 and −35 motifs; and (D) +1 start and −10 motifs. Distances between the −35, −10, and +1 start motifs are from the conserved GGAACTT, TCAAA, and A/G sequences, respectively, as marked in (A). Note that the weakly conserved spacer sequence appeared to associate with the −10 motif and was therefore incorporated into PWM−10.
Figure 3
Figure 3. σE Promoter z-Scores versus Distance Upstream of the Nearest Gene in Actual and Randomized E. coli K-12 Genomes
Only promoters less than 2,000 nt upstream of target genes are shown. (A) Scatter plot of predicted (diamonds) and known (circles) σE promoters in E. coli K-12 MG1655. (B) Topographic plot of predicted σE promoters in E. coli K-12 MG1655. The x and y axes are divided up into 200-nt and 1 unit bins, respectively, and the number of predictions falling within each bin are indicated colorimetrically as shown in the scale. Note that the data in this plot are the same as the predictions in (A). Bins containing significant predictions are indicated by yellow ovals. (C) Topographic plot indicating average number of predicted σE promoters made from 100 randomized E. coli K-12 MG1655 genomes in silico (see Materials and Methods). Each bin illustrates the average number of predictions made from 100 separate randomized genomes that fall within the parameters of that bin.
Figure 4
Figure 4. Venn Diagram of Predicted and Known σE Promoters in E. coli K-12
39 predictions from the promoter library were identified as highly significant, of which 37 were confirmed. A total of 49 known σE promoters were confirmed from the literature and additional experiments, of which 37 were successfully identified by the promoter prediction model (see text; Table 2).
Figure 5
Figure 5. Functions of the Highly Conserved σE Core Regulon Members
Stresses such as heat lead to the accumulation of unassembled OMPs; this activates the sequential proteolysis of the membrane-spanning antisigma RseA [12,54]. The inner membrane proteases DegS [b3235] and RseP [b0176] release the cytoplasmic portion of RseA, which is then degraded by the cytoplasmic proteases ClpX [b0438] and Lon [b0439] ([85]; R. Chaba unpublished data) to release free σE, which then binds to RNA polymerase core to regulate the expression of target regulon members. σE up-regulates functions required for synthesis, assembly, and/or insertion of both OMPs and LPS, the most abundant components of the outer membrane, as well as envelope-folding catalysts and chaperones. σE also up-regulates expression of itself and its negative regulator RseA and enhances expression of GreA [b3181] and σ32 [b3461]. Importantly, σE down-regulates OMP expression, thereby reducing the accumulation of unassembled OMPs, which presumably limits the duration of the response.

Comment in

References

    1. Demeler B, Zhou GW. Neural network optimization for E. coli promoter prediction. Nucleic Acids Res. 1991;19:1593–1599. - PMC - PubMed
    1. Burden S, Lin YX, Zhang R. Improving promoter prediction for the NNPP2.2 algorithm: A case study using Escherichia coli DNA sequences. Bioinformatics. 2004;1:601–607. - PubMed
    1. Horton PB, Kanehisa M. An assessment of neural network and statistical approaches for prediction of E. coli promoter sites. Nucleic Acids Res. 1992;20:4331–4338. - PMC - PubMed
    1. O'Neill MC. Escherichia coli promoters: Neural networks develop distinct descriptions in learning to search for promoters of different spacing classes. Nucleic Acids Res. 1992;20:3471–3477. - PMC - PubMed
    1. Staden R. Computer methods to locate signals in nucleic acid sequences. Nucleic Acids Res. 1984;12:505–519. - PMC - PubMed

Publication types

MeSH terms

Substances