Comparative Study
. 2005 Dec 7:6:44.
doi: 10.1186/1471-2121-6-44.

Common themes and cell type specific variations of higher order chromatin arrangements in the mouse

Affiliations
Comparative Study

Common themes and cell type specific variations of higher order chromatin arrangements in the mouse

Robert Mayer et al. BMC Cell Biol. .

Abstract

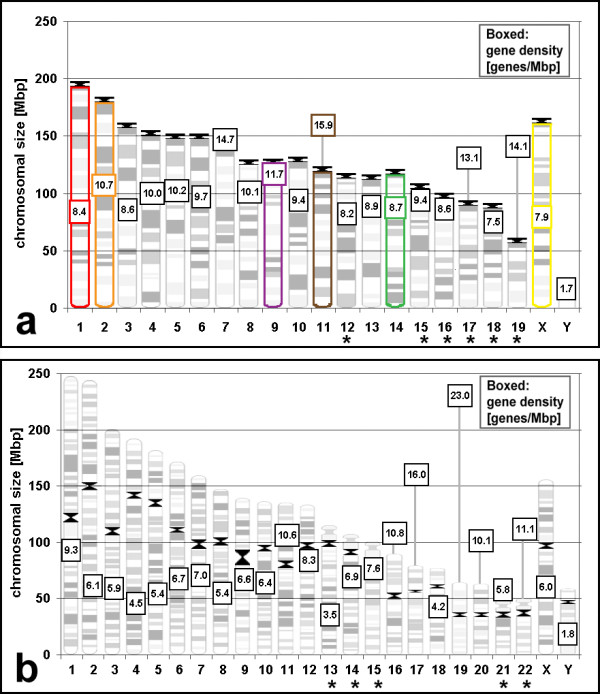
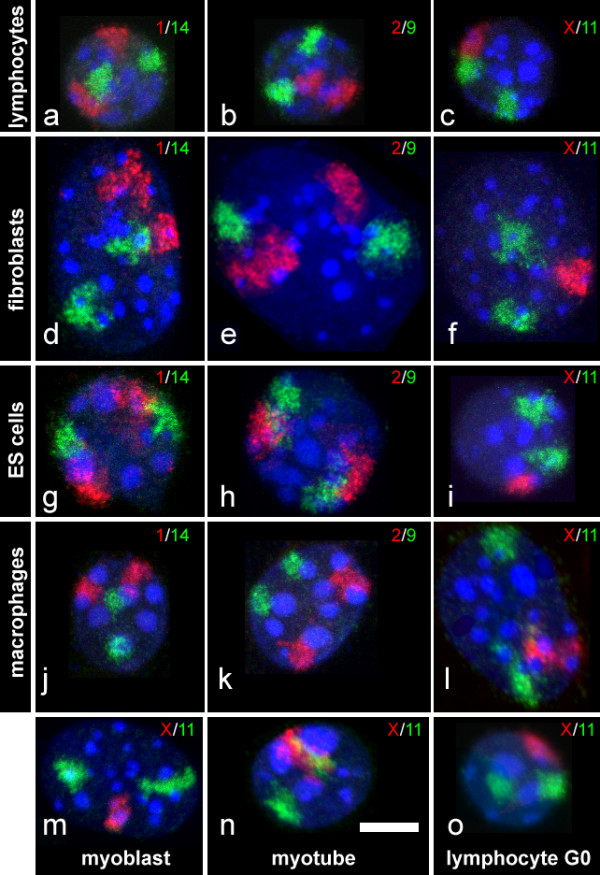
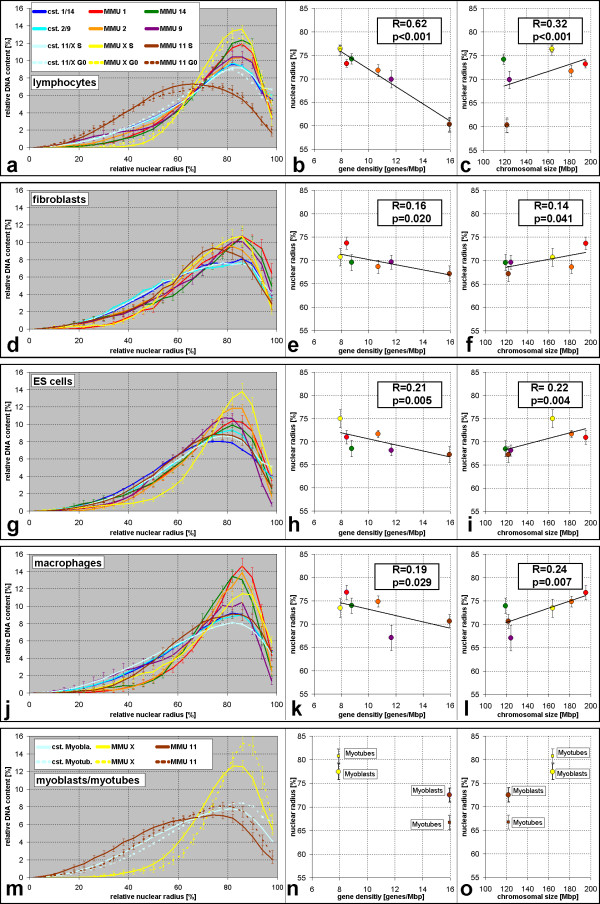
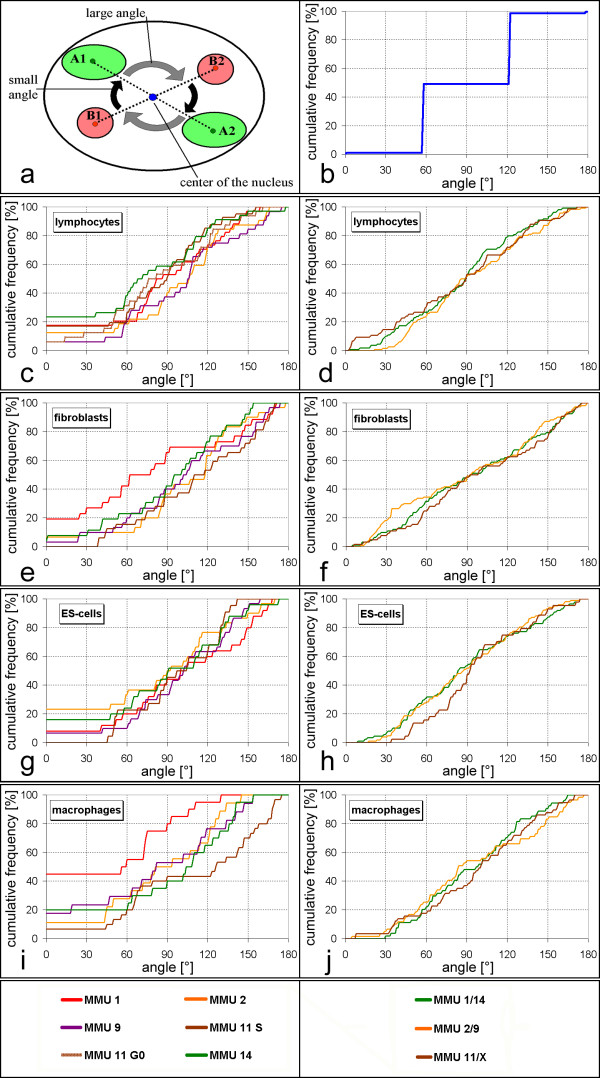
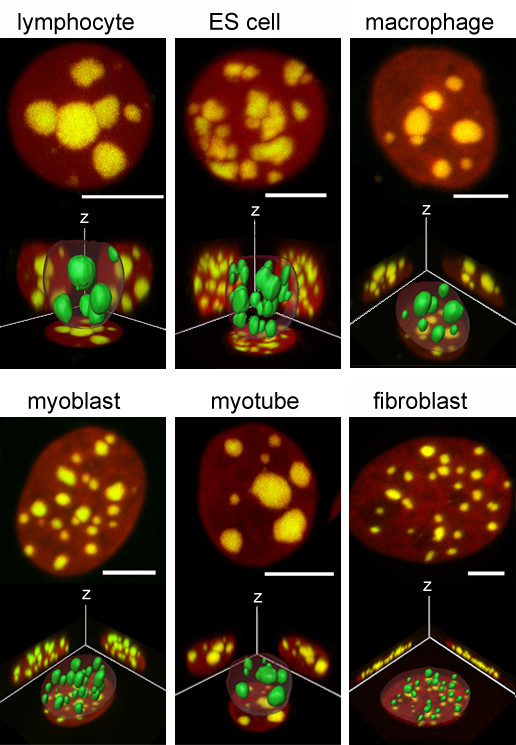
Background: Similarities as well as differences in higher order chromatin arrangements of human cell types were previously reported. For an evolutionary comparison, we now studied the arrangements of chromosome territories and centromere regions in six mouse cell types (lymphocytes, embryonic stem cells, macrophages, fibroblasts, myoblasts and myotubes) with fluorescence in situ hybridization and confocal laser scanning microscopy. Both species evolved pronounced differences in karyotypes after their last common ancestors lived about 87 million years ago and thus seem particularly suited to elucidate common and cell type specific themes of higher order chromatin arrangements in mammals.

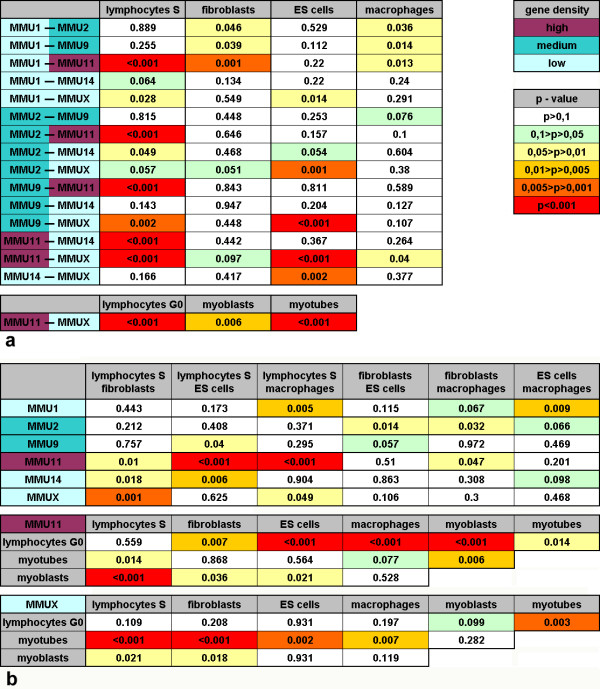
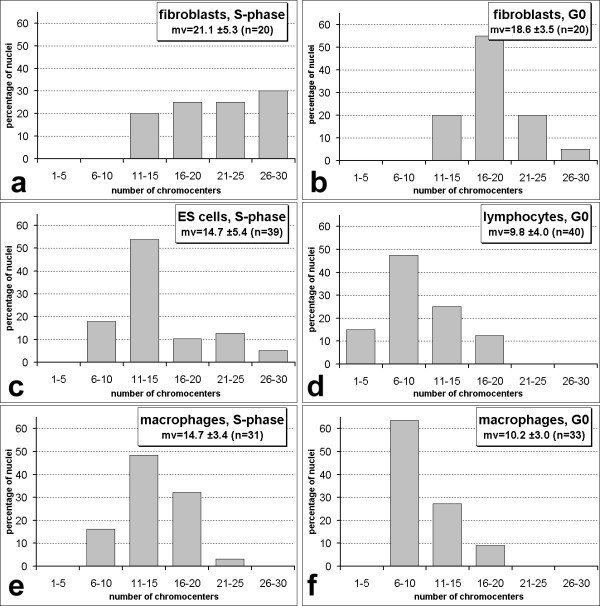
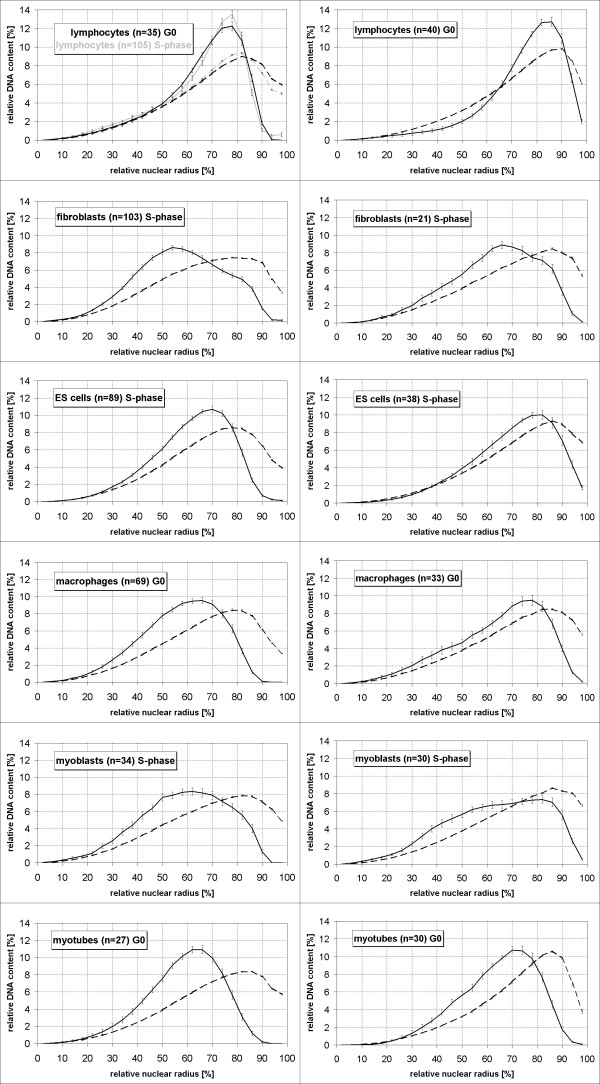
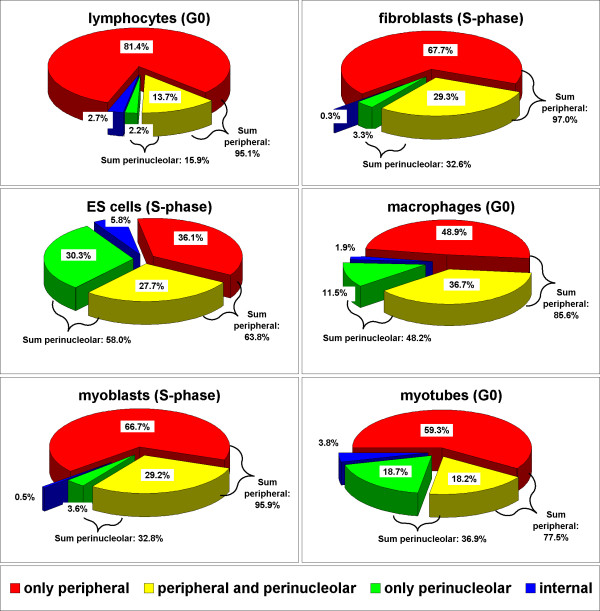
Results: All mouse cell types showed non-random correlations of radial chromosome territory positions with gene density as well as with chromosome size. The distribution of chromosome territories and pericentromeric heterochromatin changed during differentiation, leading to distinct cell type specific distribution patterns. We exclude a strict dependence of these differences on nuclear shape. Positional differences in mouse cell nuclei were less pronounced compared to human cell nuclei in agreement with smaller differences in chromosome size and gene density. Notably, the position of chromosome territories relative to each other was very variable.

Conclusion: Chromosome territory arrangements according to chromosome size and gene density provide common, evolutionary conserved themes in both, human and mouse cell types. Our findings are incompatible with a previously reported model of parental genome separation.


Figures

Figure 1
Figure 1
Sizes and gene densities of mouse (a) and human (b) chromosomes. The length of chromosomes is scaled according to their genomic size. Gene density in genes/Mbp for each chromosome is indicated in a box. The distance of the box to the x-axis is scaled according to the gene density. Centromeres are indicated in black. Chromosomes with NORs are indicated with an asterisk. Mouse chromosomes investigated in this study are surrounded with the color used in Figure 3 for their representation. (a) Mouse chromosomes have an average size of 124 ± 32 Mbp (standard deviation) and an average gene density of 10.1 ± 2.3 genes/Mbp. For both parameters the variation in human chromosomes (b) is thus much larger. They have an average size of 128 ± 56 Mbp and an average gene density of 7.3 ± 4.2 genes/Mbp. Values are disregarding the Y-chromosomes. Data are from Ensemble Genome Browser [30].
Figure 2
Figure 2
3D-FISH on structurally preserved mouse nuclei. Mouse chromosome pairs MMU1/MMU14 (a, d, g, j), MMU2/MMU9 (b, e, h, k) and MMU11/MMUX (c, f, i, l, m, n, o) were detected in S-phase lymphocytes (a, b, c), fibroblasts (d, e, f) embryonic stem cells (g,h,i), macrophages (j, k, l), myoblasts (m), myotubes (n) and G0 lymphocytes (o). TO-PRO-3 (pseudocolored blue) was used as DNA counterstain. Maximum intensity projections of confocal image stacks are shown. All images are shown to scale. Scalebar: 5 μm
Figure 3
Figure 3
Three-dimensional relative radial nuclear distribution of mouse chromosome territories from a total of 481 nuclei with two labeled pairs of chromosomes each. Each nucleus was divided in 25 shells with equal spacing. The relative amount of the signal from a given chromosome paint probe or of the DNA counterstain (cst) in each of the shells was measured and averaged over all nuclei of the respective cell type (see Methods for details). Graphs on the left (a,d,g,j,m) show the percentage of each signal in the 25 shells. Error bars in (a-o) show the standard error of the mean. For each nucleus and territory signal, the median radius of the relative radial distribution was calculated (see additional data file 1 for complete listing). Graphs in the center (b,e,h,k,n) show the averages of these medians plotted against the gene density of the painted chromosome. In the graphs on the right (c,f,i,l,o) these averages of medians are plotted against chromosomal size. For cell types with investigated territories from six types of chromosomes, the black lines show the linear regression. The box shows the correlation coefficient R and the p-value indicating the probability that there is no correlation but that the observed relation was a chance result. Both values were calculated from individual medians from all nuclei while the regression line shown was fitted to the six average values of the medians represented by the dots. (a-c) Lymphocyte nuclei in S-phase (continuous lines in (a), circles in (b), all six investigated chromosomes) and in G0 (broken lines in (a), squares in b,c, MMU11 and MMUX only). In (b,c), data points for average medians in G0 lymphocytes fall exactly on data points in S-phase and are thus difficult to distinguish. G0 lymphocytes were not included in the linear regression analysis. (d-f) Fibroblast S-phase nuclei. (g-i) ES-cell S-phase nuclei. (j-l) Macrophage G0 nuclei. Color code shown in (a) also applies to (b-l). (m-o) Myoblast (continuous lines) and myotube nuclei (broken lines). Correlation coefficients for myoblasts (0.26, p = 0.032) and myotubes (0.68, p < 0.001) are not directly comparable since only two chromosomes were investigated. Note that in all cell types there is a correlation for gene poor as well as large chromosome territories to be more peripheral, although for some chromosome territories average medians diverge from this pattern.
Figure 4
Figure 4
Statistical comparison of relative radial distributions of chromosome territories. Significance levels are shown as p-values from a two-sided Kolmogorov-Smirnov test and are color coded as indicated. Chromosome names are highlighted according to their gene density as indicated. (a) Pair wise comparison of the relative radial distributions of chromosomes in a given cell type. Lymphocytes in S-phase and in G0 are listed separately. (b) Pair wise comparison of the relative radial distributions of a given chromosome territory between cell types.
Figure 5
Figure 5
Angles between chromosome territories. (a) Scheme of fixed chromosomal angles between two pairs of chromosomes as predicted by the model of genome separation with antiparallel orientation [36]. In this example, specific angles are assumed to be about 60° and 120°. A cumulative distribution plot of homologous angles in this model has a steep increase from 0 to 100% near 180° (not shown). (b) Cumulative distribution of heterologous angles in this model example. For other chromosome pairs, angles and respective sharp increases of cumulative graphs would be at other values. Cumulative plots are shown for the indicated cell types. (c-j) Experimentally observed cumulative distributions of angles between homologous (c,e,g,i) or heterologous (d,f,h,j) chromosome territories in the indicated cell types.
Figure 6
Figure 6
3D-FISH with the mouse major satellite DNA probe. For each cell type, maximum intensity xy-projections (top) and 3D-reconstructions (bottom) are shown. In the projections, DNA counterstain (TO-PRO3) is shown in red and FISH signals are false-colored in green. Overlap of both signals in chromocenters leads to the intense yellow color. Scale bars represent 5 μm in the respective projection. The 3D-reconstructions (not to scale) are shown together with xy, xz and yz maximum intensity projections in the background. Chromocenters in the reconstructions are shown as solid green structures, while the nuclear border is presented as a transparent shell. Note the differences in number and size of chromocenters in the various cell types and the differences in nuclear shape.
Figure 7
Figure 7
Numbers of chromocenters per nucleus. Cell types are as indicated. mv = mean value, the standard deviation and the number of nuclei (n) are also given.
Figure 8
Figure 8
Three-dimensional relative radial distribution of chromocenters (continuous lines) compared to DNA counterstain (broken lines; see legend to Figure 3 and Methods for details). Chromocenters identified by high thresholds of the DNA-counterstain TO-PRO-3 (left) gave results very similar to chromocenters labeled by FISH with a mouse major satellite probe in independent experiments (right).
Figure 9
Figure 9
Association of chromocenters with the nuclear periphery and the nucleolus. Pie slices represent the percentages of chromocenters at the respective intranuclear locus in the indicated cell type. See main text for details.

References

    1. Schardin M, Cremer T, Hager HD, Lang M. Specific staining of human chromosomes in Chinese hamster x man hybrid cell lines demonstrates interphase chromosome territories. Hum Genet. 1985;71:281–287. doi: 10.1007/BF00388452. - DOI - PubMed
    1. Manuelidis L. Individual interphase chromosome domains revealed by in situ hybridization. Hum Genet. 1985;71:288–293. doi: 10.1007/BF00388453. - DOI - PubMed
    1. Lucas JN, Cervantes E. Significant large-scale chromosome territory movement occurs as a result of mitosis, but not during interphase. Int J Radiat Biol. 2002;78:449–455. doi: 10.1080/09553000110097190. - DOI - PubMed
    1. Walter J, Schermelleh L, Cremer M, Tashiro S, Cremer T. Chromosome order in HeLa cells changes during mitosis and early G1, but is stably maintained during subsequent interphase stages. J Cell Biol. 2003;160:685–697. doi: 10.1083/jcb.200211103. - DOI - PMC - PubMed
    1. Postberg J, Alexandrova O, Cremer T, Lipps HJ. Exploiting nuclear duality of ciliates to analyze topological requirements for DNA replication and transcription. J Cell Sci. 2005;118:3973–3983. doi: 10.1242/jcs.02497. - DOI - PubMed

Publication types