

An algorithm for automatic evaluation of the spot quality in two-color DNA microarray experiments
- PMID: 16336688
- PMCID: PMC1369007
- DOI: 10.1186/1471-2105-6-293
An algorithm for automatic evaluation of the spot quality in two-color DNA microarray experiments
Abstract
Background: Although DNA microarray technologies are very powerful for the simultaneous quantitative characterization of thousands of genes, the quality of the obtained experimental data is often far from ideal. The measured microarrays images represent a regular collection of spots, and the intensity of light at each spot is proportional to the DNA copy number or to the expression level of the gene whose DNA clone is spotted. Spot quality control is an essential part of microarray image analysis, which must be carried out at the level of individual spot identification. The problem is difficult to formalize due to the diversity of instrumental and biological factors that can influence the result.
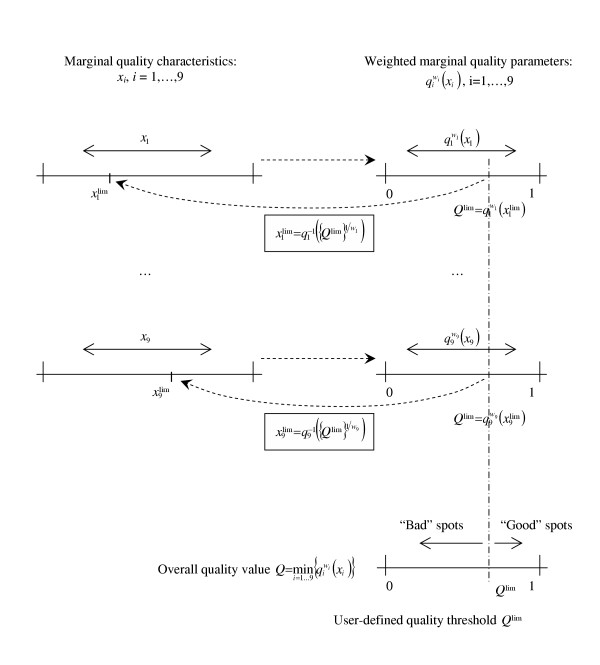
Results: For each spot we estimate the ratio of measured fluorescence intensities revealing differential gene expression or change in DNA copy numbers between the test and control samples. We also define a set of quality characteristics and a model for combining these characteristics into an overall spot quality value. We have developed a training procedure to evaluate the contribution of each individual characteristic in the overall quality. This procedure uses information available from replicated spots, located in the same array or over a set of replicated arrays. It is assumed that unspoiled replicated spots must have very close ratios, whereas poor spots yield greater diversity in the obtained ratio estimates.
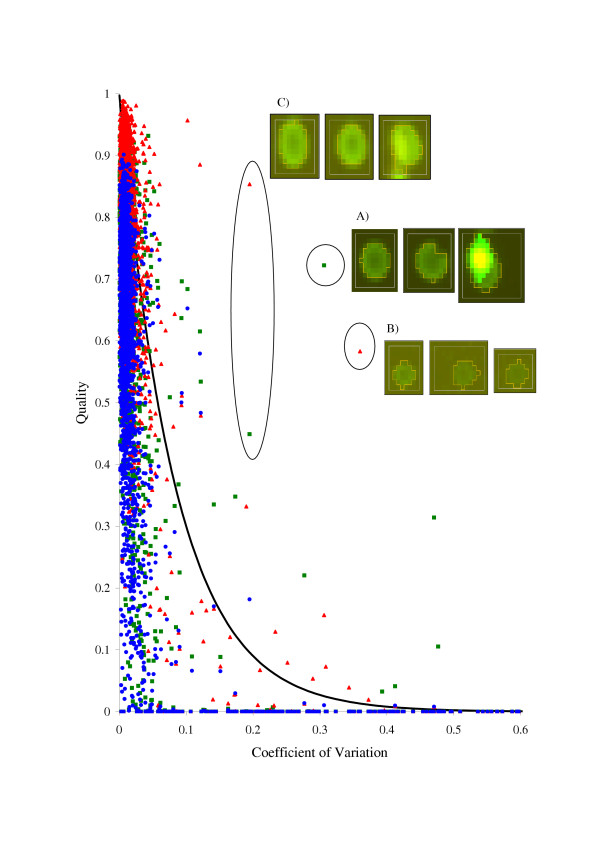
Conclusion: The developed procedure provides an automatic tool to quantify spot quality and to identify different types of spot deficiency occurring in DNA microarray technology. Quality values assigned to each spot can be used either to eliminate spots or to weight contribution of each ratio estimate in follow-up analysis procedures.
Figures


Similar articles
-
Automatic microarray spot segmentation using a Snake-Fisher model.IEEE Trans Med Imaging. 2008 Jun;27(6):847-57. doi: 10.1109/TMI.2008.915697. IEEE Trans Med Imaging. 2008. PMID: 18541491
-
Improving gene quantification by adjustable spot-image restoration.Bioinformatics. 2007 Sep 1;23(17):2265-72. doi: 10.1093/bioinformatics/btm337. Epub 2007 Jun 28. Bioinformatics. 2007. PMID: 17599935
-
Expression ratio evaluation in two-colour microarray experiments is significantly improved by correcting image misalignment.Bioinformatics. 2007 Oct 15;23(20):2686-91. doi: 10.1093/bioinformatics/btm399. Epub 2007 Aug 12. Bioinformatics. 2007. PMID: 17698492
-
Spot detection and image segmentation in DNA microarray data.Appl Bioinformatics. 2005;4(1):1-11. doi: 10.2165/00822942-200504010-00001. Appl Bioinformatics. 2005. PMID: 16000008 Review.
-
[Progress in a research on biochip image analysis].Zhongguo Yi Liao Qi Xie Za Zhi. 2007 Mar;31(2):108-11. Zhongguo Yi Liao Qi Xie Za Zhi. 2007. PMID: 17552173 Review. Chinese.
Cited by
-
Integrated imaging instrument for self-calibrated fluorescence protein microarrays.Rev Sci Instrum. 2013 Oct;84(10):103702. doi: 10.1063/1.4823790. Rev Sci Instrum. 2013. PMID: 24182114 Free PMC article.
-
Advanced spot quality analysis in two-colour microarray experiments.BMC Res Notes. 2008 Sep 17;1:80. doi: 10.1186/1756-0500-1-80. BMC Res Notes. 2008. PMID: 18798985 Free PMC article.
References
-
- Hegde P, Qi R, Abernathy K, Gay C, Dharap S, Gaspard R, Hughes JE, Snesrud E, Lee N, Quackenbush J. A concise guide to cDNA microarray analysis. Biotechniques. 2000;29:548–562. - PubMed
-
- Pinkel D, Segraves R, Sudar D, Clark S, Poole I, Kowbel D, Collins C, Kuo WL, Chen C, Zhai Y, Dairkee SH, Ljung BM, Gray JW, Albertson DG. High resolution analysis of DNA copy number variation using comparative genomic hybridization to microarrays. Nature Genetics. 1998;20:207–211. doi: 10.1038/2524. - DOI - PubMed
-
- Buhler J, Ideker T, Haynor D. Dapple: improved techniques for finding spots on DNA microarrays. UW CSE Technical Report UWTP 2000-08-05. 2000.
Publication types
MeSH terms
LinkOut - more resources
Full Text Sources
