Comparative Study
. 2005 Dec 7;25(49):11385-95.
doi: 10.1523/JNEUROSCI.2378-05.2005.

Noradrenaline triggers multivesicular release at glutamatergic synapses in the hypothalamus

Affiliations
Comparative Study

Noradrenaline triggers multivesicular release at glutamatergic synapses in the hypothalamus

Grant R J Gordon et al. J Neurosci. .

Abstract

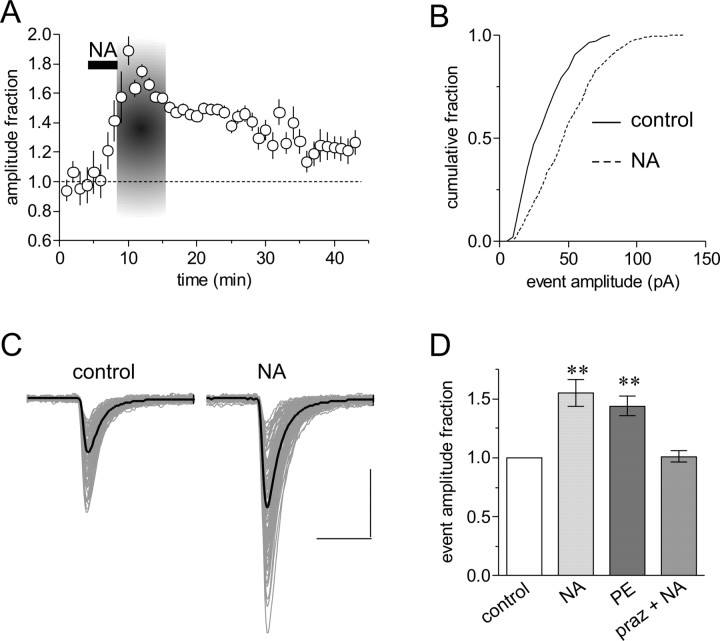
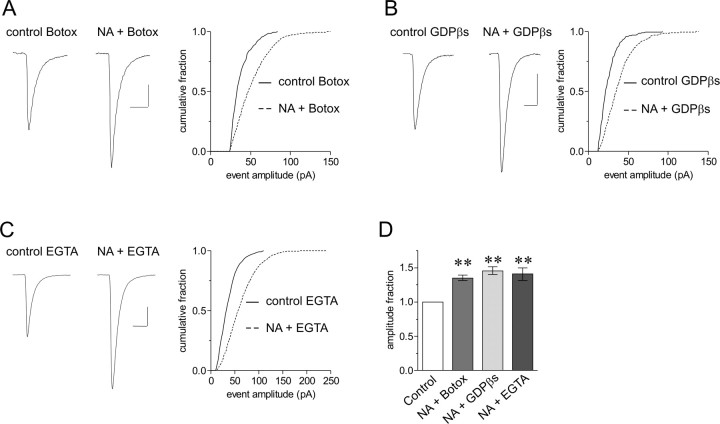
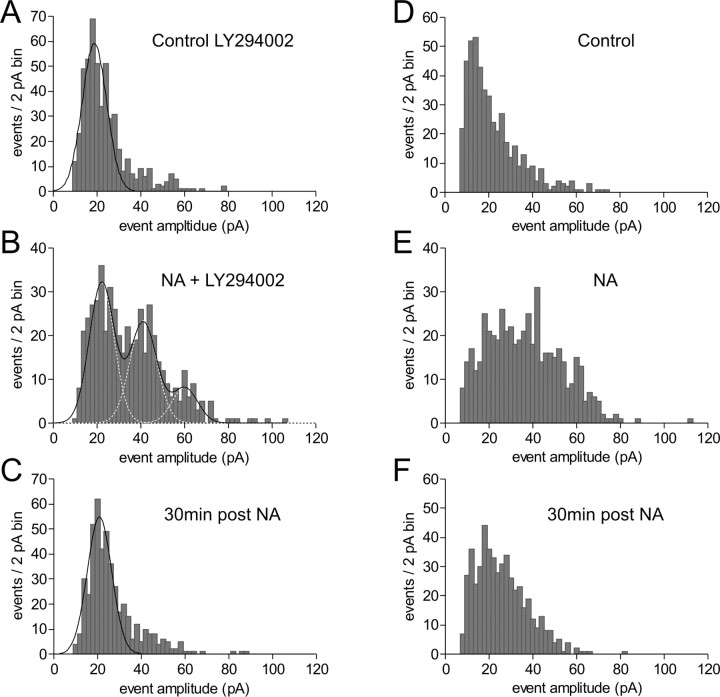
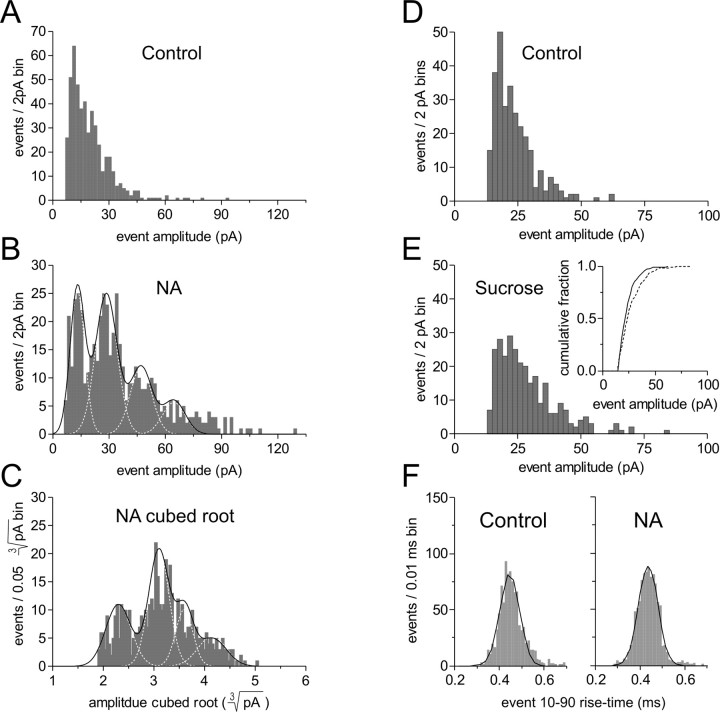
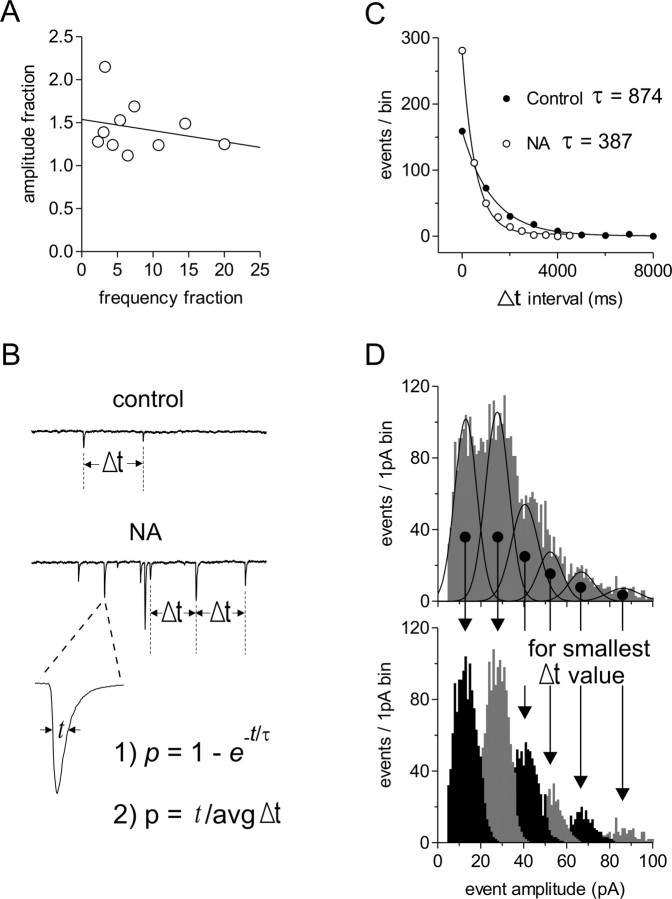
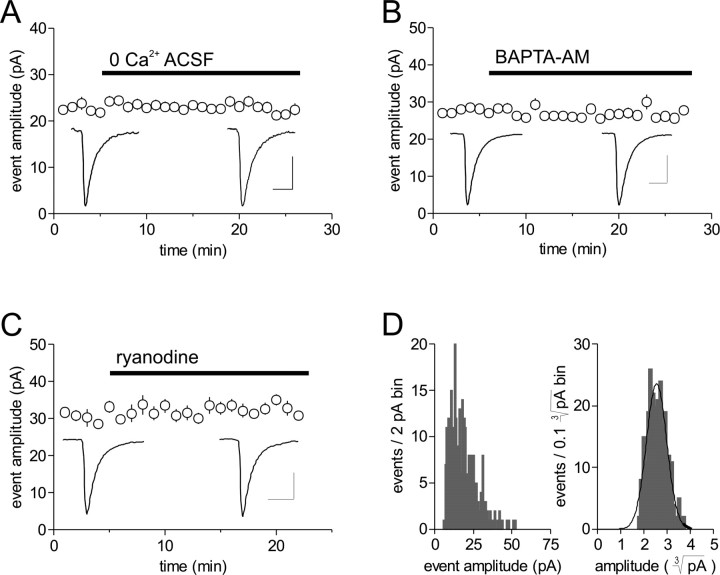
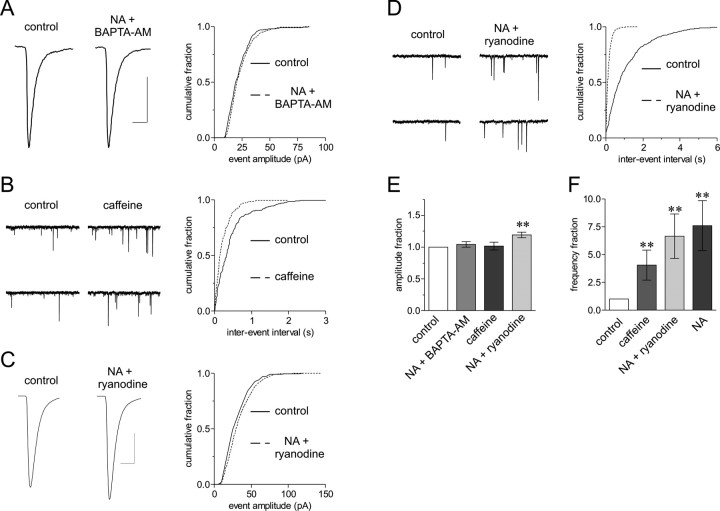
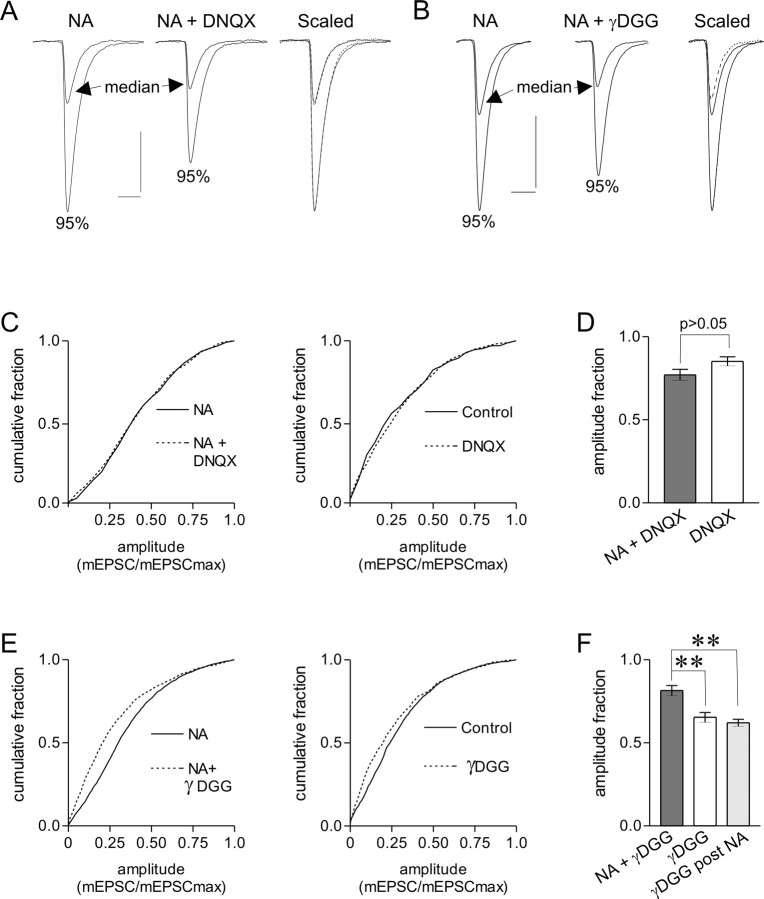
The origin of large-amplitude miniature EPSCs (mEPSCs) at central synapses remains to be firmly established. Here, we show that at excitatory synapses onto magnocellular neurosecretory cells in the hypothalamus, noradrenaline induces a rapid and robust increase in mEPSC amplitude that requires alpha1-adrenoceptor activation but is impervious to postsynaptic manipulations that block the putative insertion of AMPA receptors. In response to noradrenaline, mEPSCs exhibit a putative multimodal amplitude histogram distribution that is not attributable to random temporal summation, the unveiling of a quiescent synapse, or the release of large vesicles. Large-amplitude mEPSCs are sensitive to a high dose of ryanodine and are associated with an enhanced glutamate cleft concentration. Together, these data are consistent with the hypothesis that large-amplitude mEPSCs result from the synchronous release of multiple vesicles via rapid presynaptic calcium expulsion from intracellular stores.


Figures

Figure 1.
Figure 1.
Noradrenaline induces a robust increase in mEPSC amplitude. A, Running average of mEPSC amplitude in 2 min bins during control and in response to a 3-5 min, 200 μm bath application of NA in a single cell. The area demarcated in gray represents the time during the NA response that is compared with control values. The long-lasting increase in mEPSC amplitude caused by NA can also be observed 20 min after NA application. B, Cumulative fraction plot of mEPSC amplitudes taken from control and during NA (p<0.01); same cell as A. C, Raw mEPSCs (light gray) and average mEPSC traces (solid black) from control and NA; same cell as A. D, Summary data depicting the change in mEPSC amplitude in response to NA (1.55 ± 0.11; **p < 0.01 compared with control; n = 20), the α1-adrenoceptor agonist phenylephrine (PE) (200 μm) (1.44 ± 0.08; **p < 0.01 compared with control; n = 7), and NA in the presence of the α1-adrenoceptor antagonist prazosin (praz) (10 μm) (1.03 ± 0.06; p > 0.05; n = 8).
Figure 2.
Figure 2.
Postsynaptic manipulations fail to abolish the increase in mEPSC amplitude in response to NA. A-C, Average mEPSC traces on the left and cumulative fraction plots of mEPSC amplitude on the right. Inclusion of botulinum toxin C (5 μg/ml) (A), which blocks vesicular fusion and therefore AMPA receptor insertion, GDPβs (1 mm) (B), which blocks intercellular G-protein signaling, or EGTA (10 mm) (C), which buffers intracellular calcium, in the patch pipette failed to block the increase in mEPSC amplitude in response to NA (p < 0.01). D, Summary data showing that the NA effect remains in the presence of postsynaptic botulinum toxin C (1.35 ± 0.04; **p < 0.01 compared with control; n = 7), GDPβs (1.45 ± 0.05; **p < 0.01 compared with control; n = 5), and elevated EGTA (1.41 ± 0.09; **p < 0.01 compared with control; n = 7). Botox, Botulinum toxin C.
Figure 3.
Figure 3.
MNCs possess kinetically homogenous or heterogeneous mEPSCs. A, Left, The 10-90 rise-time histogram; right, the 10-90 decay-time histogram from a single cell. The distributions possess a single mode, suggesting that the mEPSCs are kinetically homogenous and result from a putative single population of synapses. B, Left, The 10-90 rise-time histogram; right, the 10-90 decay-time histogram from a different cell. The distributions clearly possess more than one mode, suggesting that the mEPSCs in this cell are kinetically heterogeneous and putatively result from different populations of synapses. Cells displaying characteristics shown in A were chosen for analyses; cells exhibiting characteristics shown in B were discarded.
Figure 4.
Figure 4.
The mEPSC amplitude distribution in NA displays putative equidistant modes. A, Control mEPSC amplitude distribution displaying a characteristic rightward skew, which cannot be fit well with a single Gaussian function. B, When postsynaptic AMPA receptor insertion is blocked with the phosphatidylinositol-3 kinase inhibitor LY294002, NA enhances the skew in the amplitude distribution by the appearance of putative peaks of equal amplitude increments; same cell as A. C, Thirty minutes after NA (30 min post NA) treatment, the amplitude distribution returns to the control state; same cell as A. D, Control mEPSC amplitude distribution. E, In the absence of postsynaptic blockade, NA increases the amplitude distribution skew without the clear appearance of multiple modes; same cell as D. F, Thirty minutes after NA treatment, the amplitude distribution remains slightly shifted to the right, indicative of the postsynaptic enhancement caused by NA; same cell as D.
Figure 5.
Figure 5.
Large mEPSCs in NA do not result from a previously quiescent synapse or vesicle. A, Control mEPSC amplitude distribution. B, NA amplitude distribution fit with multiple Gaussians and a sum of Gaussians function; same cell as A. C, The cubed root transform of the NA amplitude distribution in B remains multimodal, suggesting that the release of larger vesicles by NA cannot account for the prominent skew (n = 5). D, Control mEPSC amplitude distribution. E, The secretagogue sucrose fails to increase mEPSC amplitude to the same extent as NA. This is shown by a small rightward shift in the amplitude distribution and the cumulative fraction plot of mEPSC amplitudes (inset); same cell as D. F, The 10-90 rise-time histogram in control (left) remains unimodal in NA (right), suggesting that kinetically dissimilar events are not recruited during NA.
Figure 6.
Figure 6.
The increase in mEPSC amplitude by NA does not occur via random event summation. A, The NA-induced fractional increase in mEPSC frequency is not related to the corresponding fractional increases in mEPSC amplitude (slope = -0.013 ± 0.018; R2 = 0.061; n = 10). B, Schematic depicting Δt, the interevent interval, t, the average event half-width, and the two formulas used to calculate the probability of random temporal summation. C, Time interval between events is fit with a monoexponential equation in control (t = 874 ms) and in NA (t = 387 ms), and the probability of two mEPSCs summating was calculated with p(time interval ≤ t) = 1 - e-t in a single cell (control, p = 0.0016; NA, p = 0.0037) (Table 1). D, Amplitude histogram in NA fit with multiple Gaussian curves (top) showing the deconstruction of the raw data into the putative modes (bottom). The number of observations in a given mode after deconstruction is multiplied by the mode number to achieve the maximum number of quantal events that could have occurred in that time period, making the Δt value as small as possible to calculate the upper limit of event summation probability (Table 1).
Figure 7.
Figure 7.
The control distribution skew does not result from endogenous synchronization but likely results from the release of larger vesicles containing more glutamate. Bath application of calcium-free extracellular solution (A), BAPTA-AM (50 μm) (B), a lipid permeable calcium chelator with fast binding kinetics, or a high dose of ryanodine (100 μm) (C), which blocks ryanodine receptor-channels, failed to attenuate mEPSC amplitude when assessed 20 min after the beginning of treatment (pooled data; 0.96 ± 0.02; p > 0.05; n = 14) (A-C). D, The cubed root transform (right) of the control amplitude distribution (left) is Gaussian (n = 5), suggesting that vesicles containing more glutamate underlie the control amplitude distribution skew. ACSF, Artificial CSF.
Figure 8.
Figure 8.
Presynaptic calcium stores mediate NA-induced vesicle synchronization. A, An incubation period of >20 min with BAPTA-AM (50 μm) completely blocked the increase in mEPSC amplitude observed in NA, shown by average mEPSC traces (right) and an amplitude cumulative fraction plot (left). B, Caffeine treatment (5 mm) increases the frequency of mEPSCs as shown by representative voltage-clamp traces (left) and an interevent interval cumulative fraction plot (right). C, A high dose of ryanodine (100 μm) significantly reduces the amplitude increase of mEPSCs in response to NA shown by average mEPSC traces (left) and an amplitude cumulative fraction plot (right). D, Ryanodine does not block the increase in mEPSC frequency caused by NA, shown by representative voltage-clamp traces (left) and an interevent interval cumulative faction plot (right). E, Summary data showing the effects of BAPTA-AM plus NA (1.04 ± 0.04; p > 0.05; n = 4), caffeine (1.01 ± 0.06; p > 0.05; n = 5), and ryanodine plus NA (1.18 ± 0.04; **p < 0.01 versus control; n = 6) on mEPSC amplitude. F, Summary data showing the effects of caffeine (4.05 ± 1.35; **p < 0.01 versus control; n = 5), ryanodine plus NA (6.65 ± 2.00; **p < 0.01 versus control; n = 6), and NA alone (7.63 ± 2.25; **p < 0.01 versus control; n = 20) on mEPSC frequency.
Figure 9.
Figure 9.
The increase in mEPSC amplitude is accompanied by a greater concentration of glutamate in the synaptic cleft. A, Voltage-clamp traces from the median and 95th percentile of amplitude distributions in NA and NA plus DNQX (250 nm), a high-affinity AMPA receptor antagonist. DNQX uniformly attenuates mEPSCs from these percentiles. B, Same as A for NA plus γDGG (500 μm), a low-affinity AMPA receptor antagonist. γDGG attenuates the median mEPSCs more effectively. C, Cumulative amplitude distribution normalized to the largest mEPSC for NA and NA plus DNQX (left), as well as control and control plus DNQX (right). DNQX uniformly attenuates all mEPSC amplitudes (p > 0.05). D, In DNQX, the fractional mEPSC amplitude was the same in NA (0.77 ± 0.03; n = 5) and control (0.85 ± 0.03; p > 0.05; n = 5). E, Cumulative amplitude distribution normalized to the largest mEPSC for NA and NA plus γDGG (left) as well as control and control plus γDGG (right). γDGG preferentially attenuated small mEPSCs (p < 0.01), with the greatest disparity seen in NA. F, In γDGG, the fractional mEPSC amplitude was larger during NA (0.81 ± 0.03; n = 6) than either control (0.65 ± 0.03; p < 0.01; n = 5) or after NA (0.62 ± 0.02; p < 0.01; n = 5). Calibration: 20 pA, 5 ms.

References

    1. Armstrong WE, Gallagher MJ, Sladek CD (1986) Noradrenergic stimulation of supraoptic neuronal activity and vasopressin release in vitro: mediation by an alpha 1-receptor. Brain Res 365: 192-197. - PubMed
    1. Atwood HL, Karunanithi S (2002) Diversification of synaptic strength: presynaptic elements. Nat Rev Neurosci 3: 497-516. - PubMed
    1. Auger C, Marty A (2000) Quantal currents at single-site central synapses. J Physiol (Lond) 526: 3-11. - PMC - PubMed
    1. Auger C, Kondo S, Marty A (1998) Multivesicular release at single functional synaptic sites in cerebellar stellate and basket cells. J Neurosci 18: 4532-4547. - PMC - PubMed
    1. Bains JS, Ferguson AV (1997) Nitric oxide regulates NMDA-driven GABAergic inputs to type I neurones of the rat paraventricular nucleus. J Physiol (Lond) 499: 733-746. - PMC - PubMed

Publication types

LinkOut - more resources