Comparative Study
. 2006 Jan;16(1):115-22.
doi: 10.1101/gr.4249906. Epub 2005 Dec 7.

Uneven distribution of expressed sequence tag loci on maize pachytene chromosomes

Affiliations
Comparative Study

Uneven distribution of expressed sequence tag loci on maize pachytene chromosomes

Lorinda K Anderson et al. Genome Res. 2006 Jan.

Abstract

Examining the relationships among DNA sequence, meiotic recombination, and chromosome structure at a genome-wide scale has been difficult because only a few markers connect genetic linkage maps with physical maps. Here, we have positioned 1195 genetically mapped expressed sequence tag (EST) markers onto the 10 pachytene chromosomes of maize by using a newly developed resource, the RN-cM map. The RN-cM map charts the distribution of crossing over in the form of recombination nodules (RNs) along synaptonemal complexes (SCs, pachytene chromosomes) and allows genetic cM distances to be converted into physical micrometer distances on chromosomes. When this conversion is made, most of the EST markers used in the study are located distally on the chromosomes in euchromatin. ESTs are significantly clustered on chromosomes, even when only euchromatic chromosomal segments are considered. Gene density and recombination rate (as measured by EST and RN frequencies, respectively) are strongly correlated. However, crossover frequencies for telomeric intervals are much higher than was expected from their EST frequencies. For pachytene chromosomes, EST density is about fourfold higher in euchromatin compared with heterochromatin, while DNA density is 1.4 times higher in heterochromatin than in euchromatin. Based on DNA density values and the fraction of pachytene chromosome length that is euchromatic, we estimate that approximately 1500 Mbp of the maize genome is in euchromatin. This overview of the organization of the maize genome will be useful in examining genome and chromosome evolution in plants.


Figures

Figure 1.
Figure 1.
The distribution of ESTs from maize chromosomes 1, 5, and 10 in 1-cM bins on genetic linkage maps (top panel) and in 0.2-μm length bins on the physical structure of pachytene chromosomes (bottom panel). Underneath each graph is a representation of the pachytene chromosome (SC) with the short arm to the left and a circle marking the centromere. The genetic and chromosome maps of all three chromosomes are drawn to the same percentage scale. The genetic lengths have been normalized to fit the shorter RN map; otherwise the marker positions are the same as the IBM2 neighbors frame maps. The curve superimposed on each graph is a lowess smoothing function that shows the general trends of the distributions. For similar distributions for the other seven chromosomes, see Supplemental Figure 1.
Figure 2.
Figure 2.
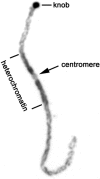
Reversed image of propidium iodide-stained chromosome 9 from a squash preparation. The positions of the centromere, knob, and heterochromatin/euchromatin boundaries are marked. The average amount of DNA per unit of pachytene chromosome length is ∼1.4 times higher for heterochromatin compared with euchromatin.
Figure 3.
Figure 3.
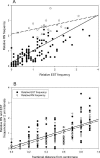
Relationship between the relative frequencies of ESTs and RNs on pachytene chromosomes. (A) For all 2-μm chromosome intervals. Open circles indicate telomeric intervals, and filled circles indicate all the other intervals. There is some overlap so not all points are visible in the graph. The regression line for all points is solid (y = 0.78x + 0.25, r2 = 0.47), and the regression line for the telomeric intervals only is dashed (y = 0.31x + 2.1, r2 = 0.20). (B) As a function of fractional arm distance of the interval from the centromere. Data for all 20 arms are pooled together, but the telomeric intervals have been omitted. The regression line for ESTs (filled circles) is solid (y = 1.81x + 0.10, r2 = 0.44), and the regression line for RNs (open triangles) is dashed (y = 1.86x–0.04, r2 = 0.64).
Figure 4.
Figure 4.
Gene clustering on maize chromosomes. Each chromosome has been divided into 2-μm intervals except where chromosome arm lengths are not evenly divisible by two. In those cases, the intervals around the centromeres are somewhat different from 2 μm. The color of each segment corresponds to its gene density ratio (observed gene density divided by expected average gene density for that chromosome), as provided in the key. The heterochromatin boundaries on either side of each centromere are indicated by brackets to the left of each chromosome.

References

    1. Akhunov, E.D., Akhunova, A.R., Linkiewicz, A.M., Dubcovsky, J., Hummel, D., Lazo, G.R., Chao, S., Anderson, O.D., David, J., Qi, L.L., et al. 2003a. Synteny perturbations between wheat homoeologous chromosomes caused by locus duplications and deletions correlate with recombination rates. Proc. Natl. Acad. Sci. 100 10836-10841. - PMC - PubMed
    1. Akhunov, E.D., Goodyear, A.W., Geng, S., Qi, L.L., Echalier, B., Gill, B.S., Gustafson, J.P., Miftahudin., Lazo, G., Chao, S., et al. 2003b. The organization and rate of evolution of wheat genomes are correlated with recombination rates along chromosome arms. Genome Res. 13 753-763. - PMC - PubMed
    1. Ananiev, E.V., Phillips, R.L., and Rines, H.W. 1998. A knob-associated tandem repeat in maize capable of forming fold-back DNA segments: Are chromosome knobs megatransposons? Proc. Natl. Acad. Sci. 95 10785-10790. - PMC - PubMed
    1. Anderson, L.K. and Stack, S.M. 2005. Recombination nodules in plants. Cytogenet. Genome Res. 109 198-204. - PubMed
    1. Anderson, L.K., Doyle, G.G., Brigham, B., Carter, J., Hooker, K.D., Lai, A., Rice, M., and Stack, S.M. 2003. High resolution crossover maps for each bivalent of Zea mays using recombination nodules. Genetics 165 849-865. - PMC - PubMed

Web site references

    1. http://www.maizegdb.org; the MaizeGDB database that contains mapping information.
    1. http://www.genome.arizona.edu/; the Arizona Genomics Institute homepage with BAC contig information.
    1. http://rgp.dna.affrc.go.jp/publicdata/geneticmap98/chr10pre.html; Genetic map information for rice chromosome 10 available at the Rice Genome Research Program.
    1. http://www.tigr.org; The Institute for Genomic Research.

Publication types

MeSH terms