. 2006 Feb 15;571(Pt 1):57-73.
doi: 10.1113/jphysiol.2005.100586. Epub 2005 Dec 8.

Cell proliferation depends on mitochondrial Ca2+ uptake: inhibition by salicylate

Affiliations

Cell proliferation depends on mitochondrial Ca2+ uptake: inhibition by salicylate

Lucía Núñez et al. J Physiol. .

Abstract

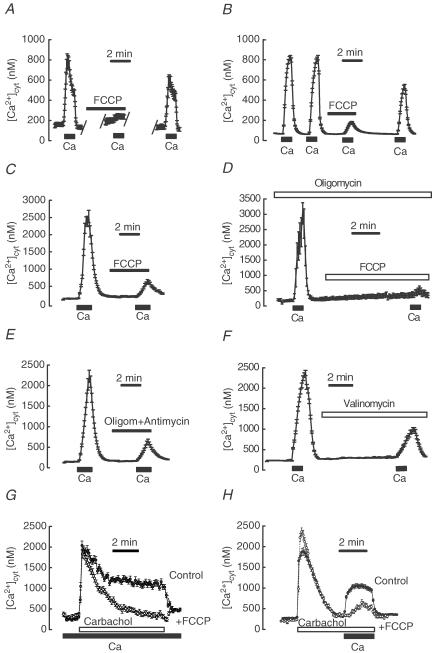
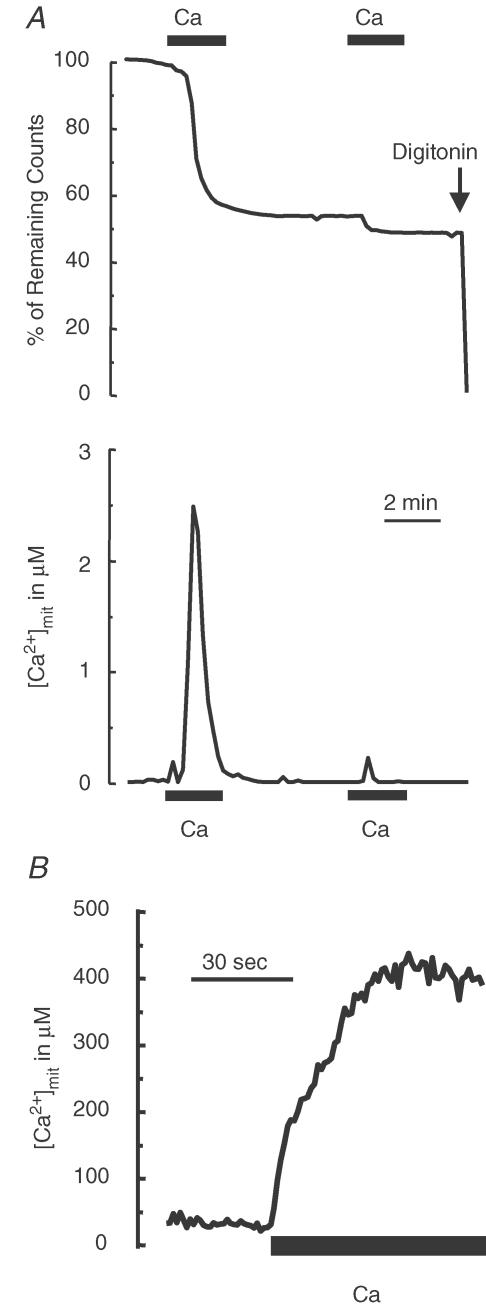
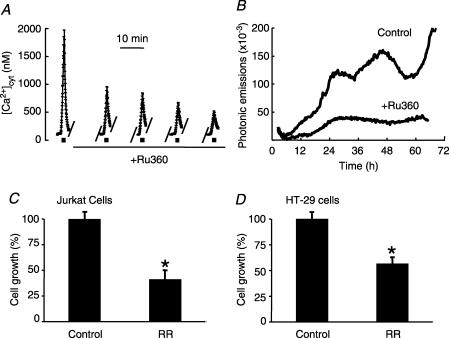
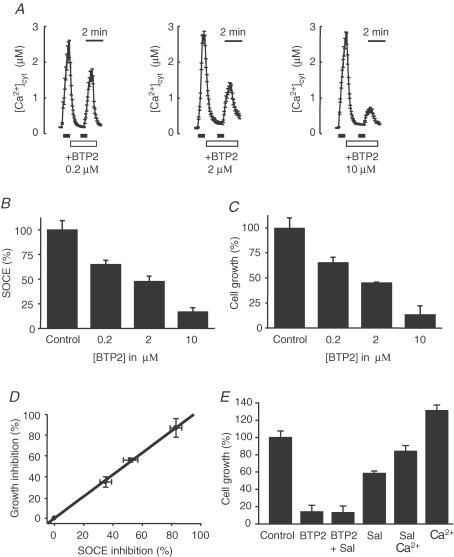
Store-operated Ca2+ entry (SOCE) is a ubiquitous Ca2+ influx pathway involved in control of multiple cellular and physiological processes including cell proliferation. Recent evidence has shown that SOCE depends critically on mitochondrial sinking of entering Ca2+ to avoid Ca2+-dependent inactivation. Thus, a role of mitochondria in control of cell proliferation could be anticipated. We show here that activation of SOCE induces cytosolic high [Ca2+] domains that are large enough to be sensed and avidly taken up by a pool of nearby mitochondria. Prevention of mitochondrial clearance of the entering Ca2+ inhibited both SOCE and cell proliferation in several cell types including Jurkat and human colon cancer cells. In addition, we find that therapeutic concentrations of salicylate, the major metabolite of aspirin, depolarize partially mitochondria and inhibit mitochondrial Ca2+ uptake, as revealed by mitochondrial Ca2+ measurements with targeted aequorins. This salicylate-induced inhibition of mitochondrial Ca2+ sinking prevented SOCE and impaired cell growth of Jurkat and human colon cancer cells. Finally, direct blockade of SOCE by the pyrazole derivative BTP-2 was sufficient to arrest cell growth. Taken together, our results reveal that cell proliferation depends critically on mitochondrial Ca2+ uptake and suggest that inhibition of tumour cell proliferation by salicylate may be due to interference with mitochondrial Ca2+ uptake, which is essential for sustaining SOCE. This novel mechanism may contribute to explaining the reported anti-proliferative and anti-tumoral actions of aspirin and dietary salicylates.


Figures

Figure 1
Figure 1. Store-operated Ca2+ entry is prevented by collapsing mitochondrial potential in Jurkat and colon cancer cells
SOCE was started by addition of Ca2+ to thapsigargin-treated (1 μm, 10 min), fura-2-loaded cells incubated in Ca2+-free medium. A and B, effects of FCCP (10 μm) in Jurkat (A) and HT29 cells (B). C and D, effects of FCCP (10 μm) and oligomycin (0.12 μm) plus FCCP (10 μm) on Ca2+ entry in fura-4 F-loaded HT29 cells. E and F, effects of oligomycin (0.12 μm) plus antimycin A (0.5 μg ml−1) and valinomycin (10 μm) on SOCE in HT29 cells. G and H, carbachol (100 μm) elicited a biphasic [Ca2+]cyt increase in HT29 cells loaded with fura-4 F. In G, cells were perfused in Ca2+-containing medium with or without (control; •) FCCP (10 μm). FCCP inhibited the sustained but not the transient [Ca2+]cyt increase. In H, cells were perfused with Ca2+-free medium, except for the period indicated (Ca) in which perfusion was shifted to Ca2+-containing medium. All traces of [Ca2+]cyt are averaged values (mean ±s.e.m.) of 28–56 cells and representative of 3–9 similar experiments.
Figure 2
Figure 2. Store-operated Ca2+ entry induces mitochondrial Ca2+ uptake
A, HT29 cells were transfected with mitochondria targeted aequorin and subjected to photon counting measurements for estimation of [Ca2+]mit (see Methods). Cells were first treated with 1 μm thapsigargin for 10 min in Ca2+-free medium and Ca2+ entry was started by addition of external Ca2+ (1 mm; Ca). The top panel shows aequorin consumption and the bottom one the [Ca2+]mit estimate (see Methods for details). Data are representative of 3 similar experiments. B, HT29 cells were transfected with the low Ca2+ affinity mutated mitochondria-targeted aequorin, reconstituted with coelenterazine n and subjected to photon counting measurements. Other details as in A. For calibration of [Ca2+]mit, the size of the mitochondrial pool was assumed to contain 45% of the aequorin. Data are representative of 5 similar experiments.
Figure 3
Figure 3. Salicylate depolarizes mitochondria
A, confocal images of HT29 cells loaded with JC-1 (1 μg ml−1, 10 min) in vehicle (Control) or salicylate (+Sal, 500 μm, 10 min). Emitted red and green fluorescence corresponds to energised and depolarized mitochondria, respectively. Bar represents 10 μm. B, values of ratios (mean ±s.e.m.; n = 4) of red/green fluorescence in control, salicylate- and FCCP- (10 μm, 10 min) treated cells. *P < 0.05 versus control (Student's t test). C, decrease of TMRE fluorescence induced by FCCP (10 μm) and different salicylate concentrations (in μm) in HT29 cells. The arrow indicates addition of either vehicle, FCCP or salicylate. Fluorescence values for each individual cell were normalized relative to the value before treatment. Traces correspond to the averaged (mean ±s.e.m.), normalized recordings of 48–76 cells. Pictures show TMRE fluorescent images of the same cells before (Control) and 5 min after addition of 500 μm salicylate (+Sal) or 10 μm FCCP (see also Supplemental movie 1). Bar represents 10 μm. D, dose–response relation of TMRE fluorescence quenching by treatment with salicylate; values are mean ±s.e.m. of three independent experiments. All points were significantly different from control (P < 0.05). E, confocal images of bright field and TMRE-loaded HT29 cells in vehicle (Control), 10 min after 500 μm salicylate (+Sal) and 10 min after 10 μm FCCP (+FCCP). Bar represents 10 μm. The ratio of TMRE fluorescence in mitochondria relative to the surrounding cytosol was calculated as reported by Collins et al. (2002). Salicylate and FCCP largely decreased this ratio in both HT29 (F) and Jurkat (G) cells. Data correspond to 12 HT29 and 15 Jurkat cells studied in 3 independent experiments for each cell type.
Figure 4
Figure 4. Salicylate prevents mitochondrial Ca2+ uptake
Effects of salicylate (concentrations in μm) and FCCP (10 μm) on the Ca2+ uptake by mitochondria. A, HT29 cells expressing mutated mitochondrial aequorin were permeabilized and [Ca2+]mit was calculated from photonic emissions (details as in Fig. 2). Ca2+ uptake was started by perfusion with 6 μm Ca2+ (filled bar). B, average effects of different salicylate concentrations on mitochondria Ca2+ uptake in 3 experiments similar to that shown in A. Data are mean ±s.e.m. All points were significantly different from control.
Figure 5
Figure 5. Salicylate prevents store-operated Ca2+ entry
Effects of different salicylate concentrations (in μm) on SOCE in thapsigargin-treated, fura-4 F-loaded, HT29 (A) and Jurkat (B) cells. Each couple of traces correspond to [Ca2+]cyt recordings either before and after incubation (10 min) with different salicylate concentrations in the same cells. Each trace is the mean ±s.e.m. of 29–59 cells. C and D, dose–response curves of effects of salicylate on SOCE inhibition induced by salicylate in HT29 (C) and Jurkat (D) cells. Each value is the mean ±s.e.m. of 3 experiments. E, effects of salicylate (2 mm) on Ca2+ entry induced by carbachol (100 μm) in HT29 cells (traces are the mean ±s.e.m. of 23 and 32 cells and representative of 3 similar experiments). F, effects of salicylate (2 mm) on Ca2+ entry induced by TCR stimulation in Jurkat cells (0.5 μg ml−1 anti-CD3 and 5 μg ml−1 anti-CD28 cross-linked with IgG2a). Traces are mean ±s.e.m. of 12 and 22 cells and representative of 3 similar experiments.
Figure 6
Figure 6. Salicylate inhibits tumour cell growth
Effects of different concentrations of salicylate (in μm) on HT29 (A) and Jurkat (B) cell growth, expressed as cell number fold increase. All the groups differed statistically from each other except for the effects of 500 μm salicylate (not shown) that were not significantly different from the effects of 100 μm salicylate. Dose–response curve of the effects of salicylate on HT29 (C) and Jurkat (D) cell growth. E and F, correlation between growth inhibition (%) and SOCE inhibition (%) in HT29 (E) and Jurkat (F) cells. Lines are best linear fit (r = 0.94–0.96; P < 0.005–0.05). G and H, effects of salicylate on percentage of dead cells (cells stained with trypan blue) after 96 h incubation with the different salicylate concentrations (in μm) in HT29 (G) and Jurkat (H) cells. Cell death induced by 10, 100 or 500 μm salicylate were not significantly different from control (P > 0.05).
Figure 7
Figure 7. Effects of salicylate on cell ATP and apoptosis
A, effects of salicylate on cell ATP concentrations in HT29 cells measured by the luciferin/luciferase assay. Salicylate (10– 2000 μm) did not affect ATP concentrations (P > 0.05). B, the effect of salicylate on the per cent of apoptotic cells was tested by the tunel assay. Pictures show HT29 cell nuclei (blue) and apoptotic cells (red) in vehicle (control) and cells treated with different concentrations of salicylate. The bar represents 10 μm. B, bars show the per cent of apoptotic cells in each condition (mean ±s.e.m., n = 3). Salicylate did not induce apoptosis at concentrations of 10– 2000 μm (P > 0.05).
Figure 8
Figure 8. Salicylate inhibits cell cycle-driven gene transcription
Transcription activity of topoisomerase-IIα and cell division were monitored for 72 h at 15 min intervals by concurrent bioluminescence imaging and bright field microscopy in NIH 3T3 cells expressing luciferase under control of the topoisomerase-IIα gene promoter. The pictures show accumulated photonic emissions (15 min integration period) superimposed on bright field images in control (top) and salicylate-treated cells (bottom) at 0, 24, 48 and 72 h. Bar represents 10 μm. Traces show photonic emissions at 15 min intervals for 72 h in vehicle (control) and salicylate (500 μm) containing medium. Data are representative of 15 (control) and 4 (salicylate) experiments. See also Supplemental movie 2.
Figure 9
Figure 9. Ruthenium compounds inhibit store-operated Ca2+ entry, cell cycle driven gene transcription and tumour cell growth
A, effects of 6 μm Ru360 on SOCE in HT29 cells loaded with fura-4 F. Each trace is the mean ±s.e.m. of 54 cells (data representative of 3 experiments). B, transcription cycling of topoisomerase-IIα in 3T3 cells treated with vehicle (control) or 6 μm Ru360. Data representative of 15 (control) and 3 (Ru360) independent experiments. C and D, effects of ruthenium red (RR, 100 μm, 96 h) on Jurkat (C) and HT29 (D) cell growth (n = 3). *P < 0.05 versus control (Student's t test). Similar results were obtained with Ru360 (data not shown).
Figure 10
Figure 10. BTP-2 inhibits store-operated Ca2+ entry (SOCE) and cell growth
A, effects of different BTP-2 concentrations (in μm) on SOCE in HT29 cells loaded with fura-4 F. Each trace is the average (mean ±s.e.m.) of 29–83 cells. B, dose dependency of the effects of BTP-2 on SOCE (%). Each value, expressed as percentage of control, is the mean ±s.e.m. of 3 experiments. Each bar was significantly different from the others (P < 0.05). C, dose dependence of the effects of BTP-2 on HT29 cell growth. Each bar represents the mean ±s.e.m. of 3 experiments. Each bar was significantly different from the others (P < 0.05). D, correlation between SOCE inhibition (%) and growth inhibition (%) induced by BTP-2 in HT29 cells. The line is the best linear fit of experimental data shown in B and C (r = 0.999; P < 0.0001). E, effects of BTP-2 (BTP2, 10 μm), salicylate (500 μm, Sal) and both (BTP2 + Sal) on cell growth in HT29 cells. Salicylate did not increase inhibition of cell growth induced by BTP-2. Effects of increasing extracellular Ca2+ concentration from 1.8 mm (control) to 3.8 mm (+Ca2+). High Ca2+ essentially restored the inhibitory effects of salicylate. Each bar represents the mean ±s.e.m. of 3 experiments. Each bar was significantly different (P < 0.05) from the others except for BTP-2 alone versus BTP-2 plus salicylate.

Similar articles

Cited by

References

    1. Aceves M, Dueñas A, Gómez C, San Vicente E, Sánchez Crespo M, García-Rodríguez C. A new pharmacological effect of salicylates, inhibition of NFAT-dependent transcription. J Immunol. 2004;173:5721–5729. - PubMed
    1. Alvarez J, Montero M. Ca2+ measurements with luminescent proteins in the endoplasmic reticulum. In: Petersen OH, editor. Measuring Calcium and Calmodulin Inside and Outside Cells. Berlin: Springer Laboratory Manual, Springer; 2001. pp. 147–163.
    1. Alvarez J, Montero M, García-Sancho J. Agonist-induced Ca2+ influx in human neutrophils is not mediated by production of inositol polyphosphates but by emptying of the intracellular Ca2+ stores. Biochem Soc Transact. 1994;22:809–813. - PubMed
    1. Baron JA, Cole BF, Sandler RS, Haile RW, Ahnen D, Bresalier R, et al. A randomized trial of aspirin to prevent colorectal adenomas. N Engl J Med. 2003;348:891–899. - PubMed
    1. Bernardi P. Mitochondrial transport of cations: channels, exchangers and permeability transition. Physiol Rev. 1999;79:1127–1155. - PubMed

Publication types

MeSH terms

Substances

LinkOut - more resources