Comparative Study
. 2005 Dec;4(12):2140-52.
doi: 10.1128/EC.4.12.2140-2152.2005.

Genetic and molecular analysis of phytochromes from the filamentous fungus Neurospora crassa

Affiliations
Comparative Study

Genetic and molecular analysis of phytochromes from the filamentous fungus Neurospora crassa

Allan C Froehlich et al. Eukaryot Cell. 2005 Dec.

Abstract

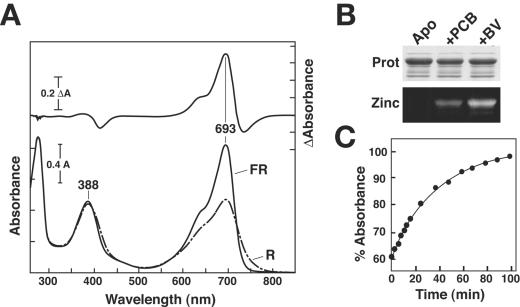
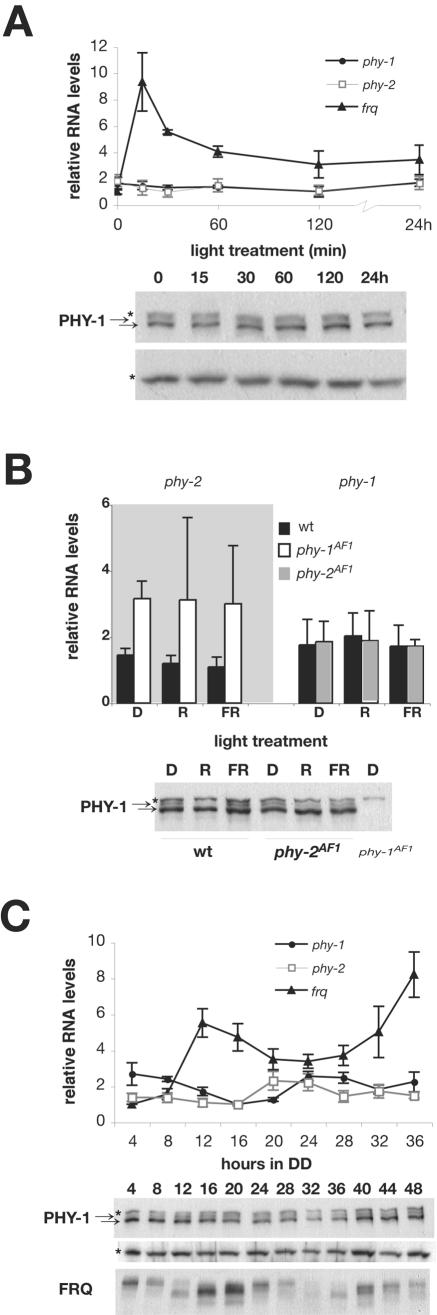
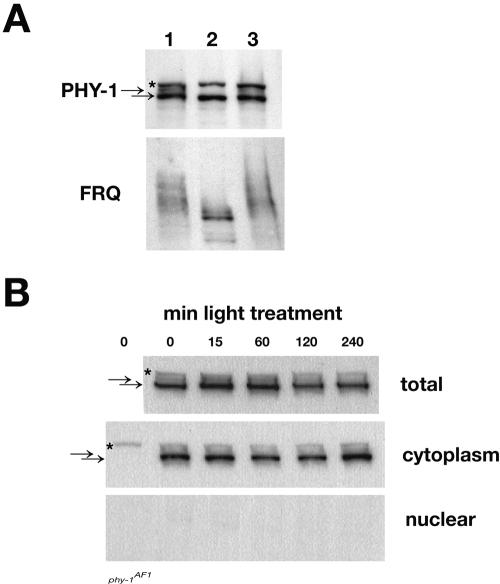
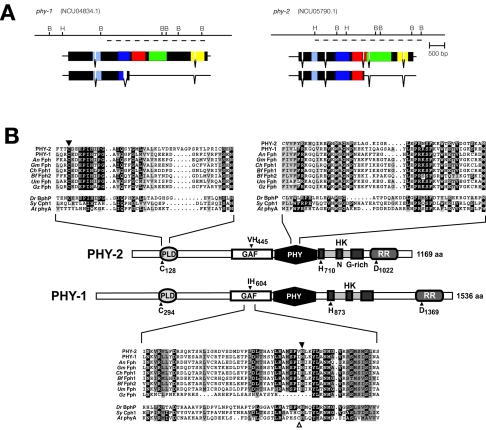
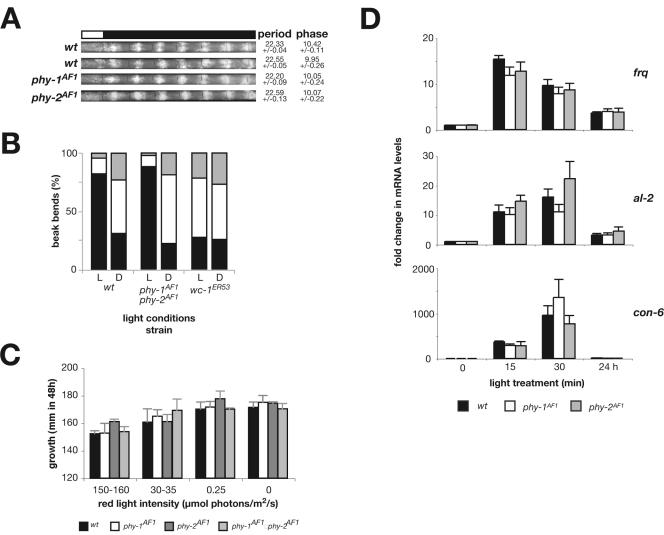
Phytochromes (Phys) comprise a superfamily of red-/far-red-light-sensing proteins. Whereas higher-plant Phys that control numerous growth and developmental processes have been well described, the biochemical characteristics and functions of the microbial forms are largely unknown. Here, we describe analyses of the expression, regulation, and activities of two Phys in the filamentous fungus Neurospora crassa. In addition to containing the signature N-terminal domain predicted to covalently associate with a bilin chromophore, PHY-1 and PHY-2 contain C-terminal histidine kinase and response regulator motifs, implying that they function as hybrid two-component sensor kinases activated by light. A bacterially expressed N-terminal fragment of PHY-2 covalently bound either biliverdin or phycocyanobilin in vitro, with the resulting holoprotein displaying red-/far-red-light photochromic absorption spectra and a photocycle in vitro. cDNA analysis of phy-1 and phy-2 revealed two splice isoforms for each gene. The levels of the phy transcripts are not regulated by light, but the abundance of the phy-1 mRNAs is under the control of the circadian clock. Phosphorylated and unphosphorylated forms of PHY-1 were detected; both species were found exclusively in the cytoplasm, with their relative abundances unaffected by light. Strains containing deletions of phy-1 and phy-2, either singly or in tandem, were not compromised in any known photoresponses in Neurospora, leaving their function(s) unclear.


Figures

FIG. 2.
FIG. 2.
Assembly and spectral properties of a recombinant N-terminal fragment of PHY-2 containing amino acids 1 to 515. (A) Absorbance and difference spectra of the PHY-2 (1-515) holoprotein assembled with BV following saturating irradiations with R and FR. The absorbance maxima of Pr are indicated. (B) Covalent binding of BV and PCB to PHY-2 (1-515). Apo-PHY-2 (1-515) was incubated with or without BV and PCB, purified by nickel-chelate affinity chromatography, and then subjected to SDS-PAGE and either stained for protein with Coomassie blue (top) or assayed for the bound bilin by zinc-induced fluorescence (bottom). (C) Dark reversion of PHY-2 (1-515) from Pfr to Pr. The holoprotein assembled with BV was photoconverted to an equilibrium mixture containing Pfr and Pr and then incubated at 24°C in the dark. Reversion of Pfr to Pr was monitored by the increase in absorbance at 693 nm.
FIG. 3.
FIG. 3.
Light and circadian regulation of phy-1 and phy-2 transcripts and PHY-1 protein. (A) (Top) Quantitative real-time PCR analysis of phy-1, phy-2, and frq transcript levels following white-light treatments varying from 0 to 24 h. The error bars are the standard errors of the mean (SEM); n = 3. (Bottom) Western blot analysis of PHY-1 following white-light treatments varying from 0 to 24 h. The arrows highlight the two forms of PHY-1. The asterisks indicate nonspecific bands which cross-react with the PHY-1 antisera. The lower blot is shown as a loading control. (B) (Top) Quantitative real-time PCR analysis of phy-1 and phy-2 transcript levels in the dark (D) or following 12 h of R or FR treatment. phy-1 transcript levels were determined in wt and phy-2AF1 strains. phy-2 transcript levels were determined in wt and phy-1Af1 strains. The data were normalized to the lowest values for each transcript, which were set to 1. The absolute levels of phy-1 and phy-2 transcripts, therefore, cannot be directly compared. The error bars are the SEM; n = 3. (Bottom) Western blot analysis of PHY-1 in the dark or following 12 h of red- or far-red-light treatment in wt and phy-2AF1 strains. The arrows and asterisks are the same as in panel A. (C) (Top) Quantitative real-time PCR analysis of phy-1, phy-2, and frq transcript levels in constant darkness throughout 1.5 circadian cycles. The error bars are the SEM; n = 4. (Bottom) Western blot analysis of PHY-1 and FRQ in constant darkness over a 48-h period. The arrows and asterisks are the same as in panel A.
FIG. 4.
FIG. 4.
PHY-1 is exclusively cytoplasmic and phosphorylated. (A) Western blot of PHY-1 and FRQ from a dark-grown culture harvested after 20 h and treated with λPPase. Lane 1, untreated sample revealing two PHY-1-specific bands (arrows) and a nonspecific band (asterisk). Lane 2, sample treated with λPPase, resulting in the disappearance of the slower-migrating PHY-1 band. Lane 3, sample treated with λPPase and sodium vanadate (a specific inhibitor of λPPase) containing both forms of PHY-1, indicating that the slower-migrating band is specifically due to phosphorylation. FRQ served as a control for the λPPase and sodium vanadate treatments. (B) Western blot analysis of PHY-1 in cellular fractions following light treatments indicates that both forms of PHY-1 are exclusively cytoplasmic, with light having no effect on localization. A wt strain was treated with white light for durations from 0 to 240 min; samples were harvested; and total, cytoplasmic, and nuclear fractions were run on an SDS-PAGE gel and blotted for PHY-1 (indicated by arrows). A single time-zero sample for a phy-1AF1 strain is shown on the left. Equal amounts of protein were loaded for each time point, as indicated by the similar intensities of the nonspecific band in each lane (indicated by an asterisk). Proper fractionation was assayed by immunoblotting with antibodies against WC-1, a predominately nuclear protein (data not shown).
FIG. 1.
FIG. 1.
Domain structure and amino acid sequence comparison of two Neurospora phytochromes. (A) Domains and intron/exon structures of PHY-1 (left) and PHY-2 (right). The two splice variants detected for each Phy are depicted directly below a schematic representation of the genomic DNA of each locus. The thin black line at the top represents the genomic locus, with letters indicating the relative positions of restriction sites: B, BamHI; H, HindIII. The thicker lines indicate the coding regions, with introns indicated by gaps. Conserved domains are highlighted: light blue, PLD; dark blue, GAF domain; red, PHY domain; green, HK domain; yellow, RR domain. The dashed lines indicate the genomic regions deleted in the deletion strains. (B) Amino acid sequence alignments of the PLD and the GAF and PHY domains of PHY-1, PHY-2, several predicted fungal phytochromes (Fphs), and single representatives of the BphPs, Cphs, and plant phytochromes. The position of each domain in Phys is shown using PHY-2 and PHY-1 to help locate the region in the Phy polypeptide. The top left alignment compares the sequences surrounding the N-terminal PLD used by Agrobacterium tumefaciens BphP1 to covalently bind bilins by a cysteine thioether linkage. The cysteine is identified by the arrowhead. The top right alignment shows the PHY domain. The bottom alignment includes the region of the GAF domain that binds bilins via a cysteine thioether linkage in Cphs and plant Phys or that may bind bilins by a histidine Schiff base linkage in some BphPs. The cysteine and histidine residues are identified by the open and closed arrowheads, respectively. Black and gray boxes denote identical and similar residues, respectively. Shown are Arabidopsis thaliana (At), Aspergillus nidulans (An), Botryotinia fuckeliana (Bf), Cochliobolus heterostrophus (Ch), Deinococcus radiodurans (Dr), Giggerella moniliformis (Gm), Gibberella zeae (Gz), Synechocystis PCC6803 (Sy), and Ustilago maydis (Um).
FIG. 5.
FIG. 5.
PHY-1 and PHY-2 do not play a role in previously described Neurospora photobiology. phy-1AF1 and phy-2AF1 strains were assayed for defects in developmental processes known to be light regulated (A, B, and D) and for novel photobiology (C). (A) PHY-1 and PHY-2 do not play roles in light resetting of the Neurospora clock. Race tubes were inoculated with wt, phy-1AF1, or phy-2AF1 strains, and the clock was reset with a light-to-dark transfer. The period and phase of conidial production in the phy-1AF1 and phy-2AF1 strains were similar to those in the wt. Average periods and phases with standard errors of the mean of six race tubes for each strain are shown, together with representative race tubes. (B) PHY-1 and PHY-2 are not required for phototropism of the perithecial beak. Protoperithecia were induced in wt, phy-1AF1/phy-2AF1, and wc-1ER53 mutant strains grown on petri plates. Duplicate plates for each strain were used in a cross and then placed in the dark or in directional lighting. The orientation of the resulting perithecial beaks (black, toward; white, neutral; gray, away) was scored relative to the direction of the light and plotted as a percentage of total perithecial beaks. L, light; D, dark. (C) The linear growth rates of wt and phy deletion strains are similar under various intensities of red light. Total linear growth in 48 h under conditions of constant red light was measured using race tubes. The error bars are the standard deviations (SD); n = 3. (D) Light induction of the frq, con-6, and al-2 transcripts is normal in phy-1AF1 and phy-2AF1 strains. RNA was harvested from wt, phy-1AF1, and phy-2AF1 strains grown in constant darkness or following 15 min, 30 min, or 24 h of light treatment. The transcript levels of frq (light induced to reset the clock), al-2 (light-induced carotenogenesis gene), and con-6 (light-induced conidiation gene) were determined using quantitative real-time PCR. The data are plotted with the zero-min values for each strain set to 1 so that the y axis indicates induction (n-fold) for each strain. The error bars are the SD; n = 3.

Similar articles

Cited by

References

    1. Alex, L. A., K. A. Borkovich, and M. I. Simon. 1996. Hyphal development in Neurospora crassa: involvement of a two-component histidine kinase. Proc. Natl. Acad. Sci. USA 93:3416-3421. - PMC - PubMed
    1. Aronson, B. D., K. A. Johnson, J. J. Loros, and J. C. Dunlap. 1994. Negative feedback defining a circadian clock: autoregulation of the clock gene frequency. Science 263:1578-1584. - PubMed
    1. Baima, S., G. Macino, and G. Morelli. 1991. Photoregulation of the albino-3 gene in Neurospora crassa. J. Photochem. Photobiol. B 11:107-115. - PubMed
    1. Ballario, P., P. Vittorioso, A. Magrelli, C. Talora, A. Cabibbo, and G. Macino. 1996. WHITE COLLAR-1, a central regulator of blue light responses in Neurospora, is a zinc finger protein. EMBO J. 15:1650-1657. - PMC - PubMed
    1. Bhoo, S. H., S. J. Davis, J. Walker, B. Karniol, and R. D. Vierstra. 2001. Bacteriophytochromes are photochromic histidine kinases using a biliverdin chromophore. Nature 414:776-779. - PubMed

Publication types

MeSH terms