Review
. 2005 Dec;69(4):608-34.
doi: 10.1128/MMBR.69.4.608-634.2005.

Comparative genomic analyses of the bacterial phosphotransferase system

Affiliations
Review

Comparative genomic analyses of the bacterial phosphotransferase system

Ravi D Barabote et al. Microbiol Mol Biol Rev. 2005 Dec.

Abstract

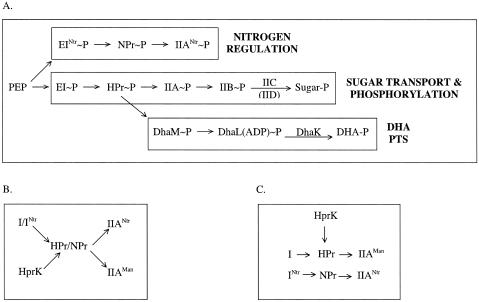
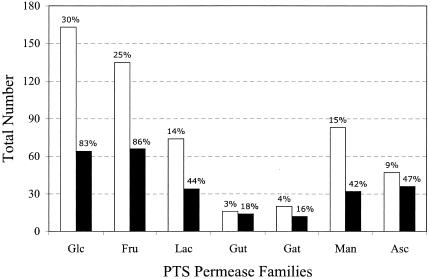
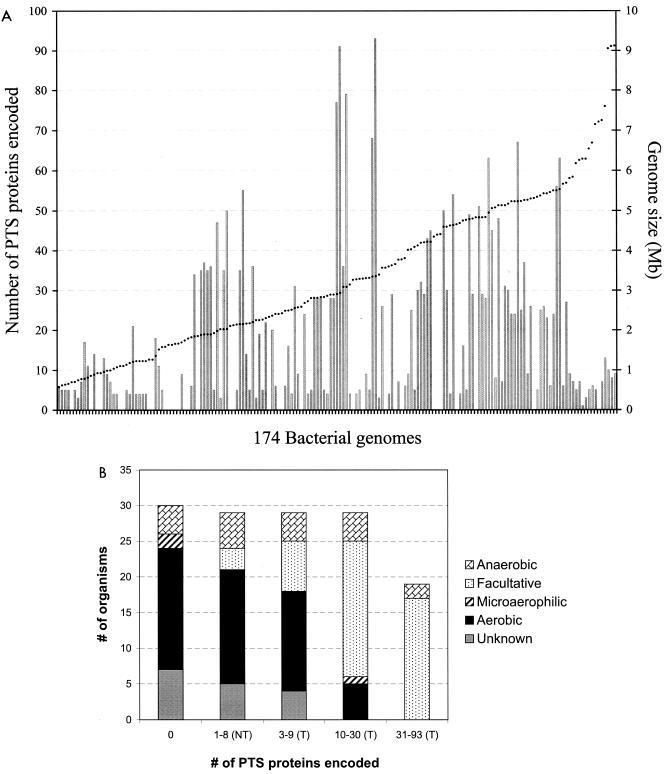
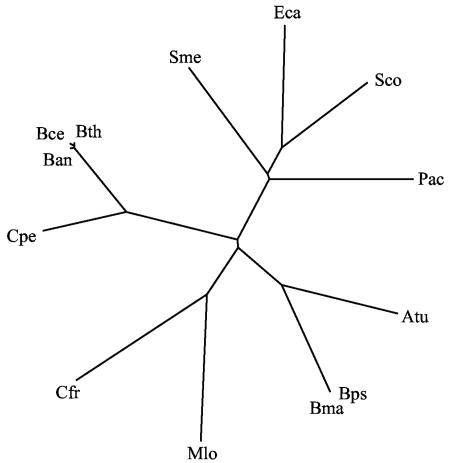
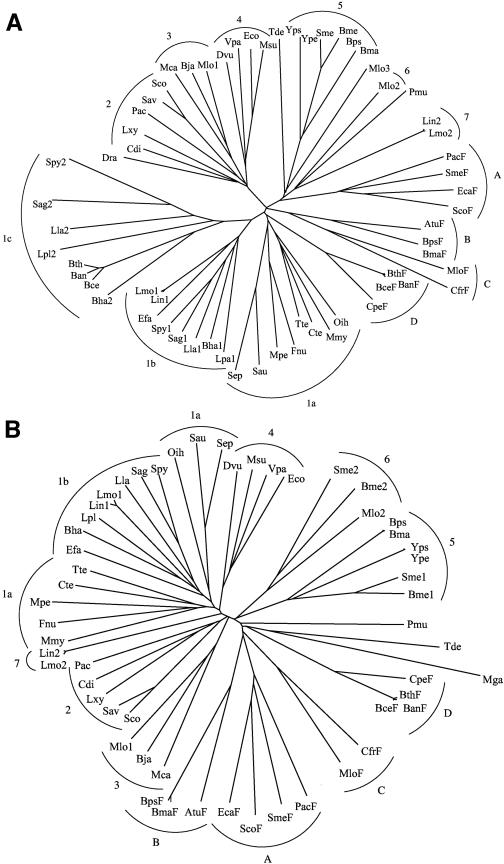
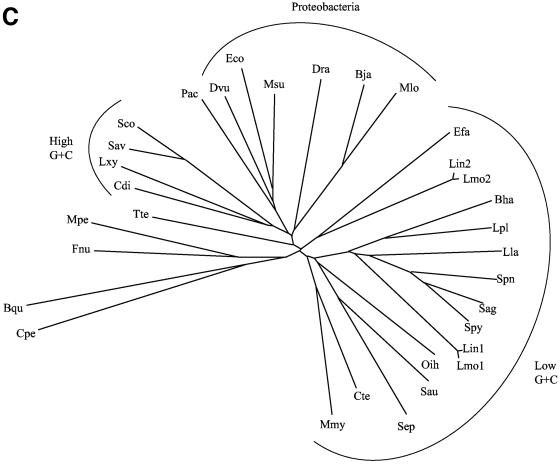
We report analyses of 202 fully sequenced genomes for homologues of known protein constituents of the bacterial phosphoenolpyruvate-dependent phosphotransferase system (PTS). These included 174 bacterial, 19 archaeal, and 9 eukaryotic genomes. Homologues of PTS proteins were not identified in archaea or eukaryotes, showing that the horizontal transfer of genes encoding PTS proteins has not occurred between the three domains of life. Of the 174 bacterial genomes (136 bacterial species) analyzed, 30 diverse species have no PTS homologues, and 29 species have cytoplasmic PTS phosphoryl transfer protein homologues but lack recognizable PTS permeases. These soluble homologues presumably function in regulation. The remaining 77 species possess all PTS proteins required for the transport and phosphorylation of at least one sugar via the PTS. Up to 3.2% of the genes in a bacterium encode PTS proteins. These homologues were analyzed for family association, range of protein types, domain organization, and organismal distribution. Different strains of a single bacterial species often possess strikingly different complements of PTS proteins. Types of PTS protein domain fusions were analyzed, showing that certain types of domain fusions are common, while others are rare or prohibited. Select PTS proteins were analyzed from different phylogenetic standpoints, showing that PTS protein phylogeny often differs from organismal phylogeny. The results document the frequent gain and loss of PTS protein-encoding genes and suggest that the lateral transfer of these genes within the bacterial domain has played an important role in bacterial evolution. Our studies provide insight into the development of complex multicomponent enzyme systems and lead to predictions regarding the types of protein-protein interactions that promote efficient PTS-mediated phosphoryl transfer.


Figures

FIG. 1.
FIG. 1.
Phosphoryl transfer chains of the bacterial phosphotransferase system. (A) Various phosphoryl relay chains of the PTS. (B) Proposed regulatory phosphoryl transfer chains based on the data in Table 7. (C) Putative phosphoryl chains in Bradyrhizobium japonicum.
FIG. 2.
FIG. 2.
Relative distribution of PTS permease families in bacterial genomes. The occurrence of the constituent permeases of the seven different PTS permease families (Glc, glucose; Fru, fructose; Lac, lactose; Gut, glucitol; Gat, galactitol; Man, mannose; Asc, ascorbate) was analyzed in the 77 bacterial species that were found to encode at least one putative complete PTS transport system. Only complete PTS permease systems were counted for this analysis; incomplete enzyme II complexes and orphan enzyme II constituents were not tabulated. Total numbers of complete PTS permeases (white bars) as well as total numbers of organisms that encode members of the different families (black bars) are presented. Values over the white bars indicate percentages of the total numbers of complete permease systems. Values over the black bars indicate percentages of the 77 organisms that have homologues of a particular family of permeases.
FIG. 3.
FIG. 3.
(A) PTS-encoding capacities of bacterial genomes. The total number of PTS protein homologues identified in an organism (bars) and the genome size, in mega-bp (dots), are plotted. Each point on the x axis indicates a different genome, with the genome size increasing from left to right, as indicated. (B) Correlation between the numbers of PTS proteins encoded in the various genomes and the oxygen requirements of the bacteria. Numbers along the x axis indicate the numbers of PTS proteins encoded in the genomes. “NT” indicates that the bacteria do not possess PTS permeases, while “T” indicates the presence of at least one PTS transport system. Bars are shaded according to metabolic capability, such as an aerobic, anaerobic, microaerophilic, facultative, or unknown oxygen requirement.
FIG. 4.
FIG. 4.
Phylogenetic tree for the putative ATP-dependent DHA kinases. The DhaKL fusion proteins from 12 organisms (Tables 10 and 11) and the known ATP-dependent dihydroxyacetone kinase from Citrobacter freundii (Cfr) were aligned using the Clustal X program, and neighbor-joining trees were generated (102). Trees were viewed using the TreeViewPPC program (113). When multiple strains of a species had been sequenced, only one orthologue was included.
FIG.5.
FIG.5.
Phylogenetic trees for DhaK (A), DhaL (B), and DhaM (C) homologues. The trees were generated as described in the legend to Fig. 4. Multiple paralogues from a single organism are distinguished by numbers at the ends of the names. For the DhaK and DhaL trees, the DhaKL fusion proteins were split into the DhaK and DhaL domains and were included in the two trees, respectively. These domains are indicated with an “F” at the ends of the names, and their clusters are designated with letters (A, B, C, and D), while the remaining homologues were grouped numerically into seven clusters. The alphabetical and numerical cluster designations were maintained in the two trees shown in panels A and B. The Clustal X program (102) was used to derive the trees. Abbreviations of organism names are listed in Tables 10 and 11.
FIG.5.
FIG.5.
Phylogenetic trees for DhaK (A), DhaL (B), and DhaM (C) homologues. The trees were generated as described in the legend to Fig. 4. Multiple paralogues from a single organism are distinguished by numbers at the ends of the names. For the DhaK and DhaL trees, the DhaKL fusion proteins were split into the DhaK and DhaL domains and were included in the two trees, respectively. These domains are indicated with an “F” at the ends of the names, and their clusters are designated with letters (A, B, C, and D), while the remaining homologues were grouped numerically into seven clusters. The alphabetical and numerical cluster designations were maintained in the two trees shown in panels A and B. The Clustal X program (102) was used to derive the trees. Abbreviations of organism names are listed in Tables 10 and 11.

Similar articles

Cited by

References

    1. Altschul, S. F., T. L. Madden, A. A. Schäffer, J. Zhang, Z. Zhang, W. Miller, and D. J. Lipman. 1997. Gapped BLAST and PSI-BLAST: a new generation of protein database search programs. Nucleic Acids Res. 25:3389-3402. - PMC - PubMed
    1. Austin, S., M. Buck, W. Cannon, T. Eydmann, and R. Dixon. 1994. Purification and in vitro activities of the native nitrogen fixation control proteins NifA and NifL. J. Bacteriol. 176:3460-3465. - PMC - PubMed
    1. Bächler, C. 2004. Catalysis and transcription control by the dihydroxyacetone kinase of Escherichia coli. Ph.D. thesis. University of Berne, Berne, Switzerland.
    1. Bächler, C., K. Flükiger-Brühwiler, P. Schneider, P. Bähler, and B. Erni. 2005. From ATP as substrate to ADP as coenzyme. Functional evolution of the nucleotide binding subunit of dihydroxyacetone kinases. J. Biol. Chem. 280:18321-18325. - PubMed
    1. Bao, Q., Y. Tian, W. Li, Z. Xu, Z. Xuan, S. Hu, W. Dong, J. Yang, Y. Chen, Y. Xue, Y. Xu, X. Lai, L. Huang, X. Dong, Y. Ma, L. Ling, H. Tan, R. Chen, J. Wang, J. Yu, and H. Yang. 2002. A complete sequence of the T. tengcongensis genome. Genome Res. 12:689-700. - PMC - PubMed

MeSH terms

Substances

LinkOut - more resources