

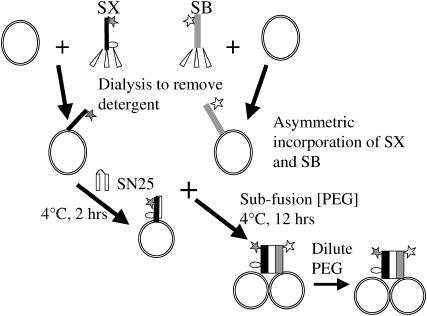
Neuronal SNAREs do not trigger fusion between synthetic membranes but do promote PEG-mediated membrane fusion
- PMID: 16339880
- PMCID: PMC1367317
- DOI: 10.1529/biophysj.105.069617
Neuronal SNAREs do not trigger fusion between synthetic membranes but do promote PEG-mediated membrane fusion
Abstract
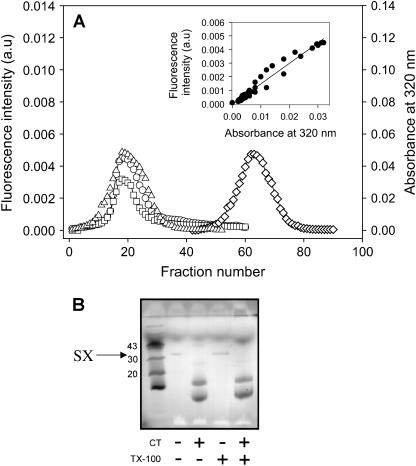
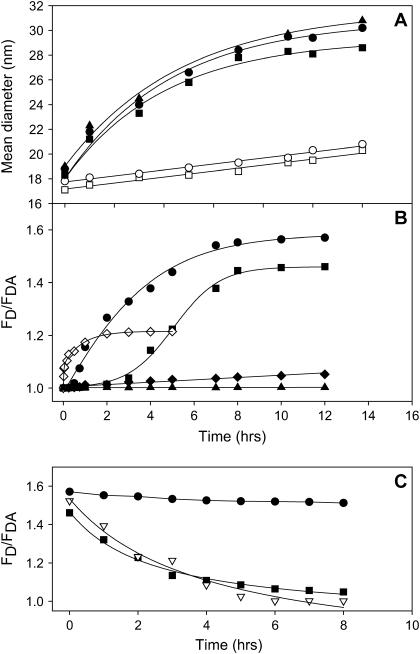
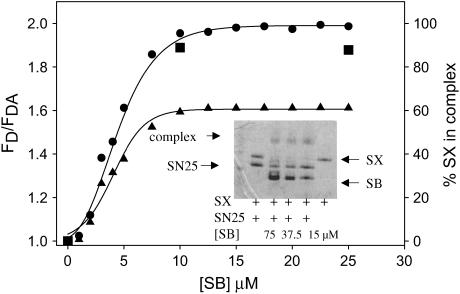
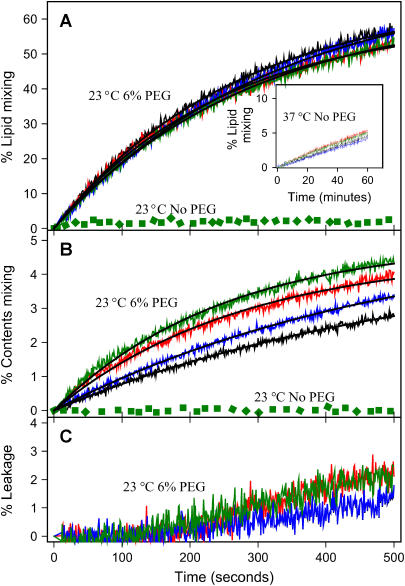
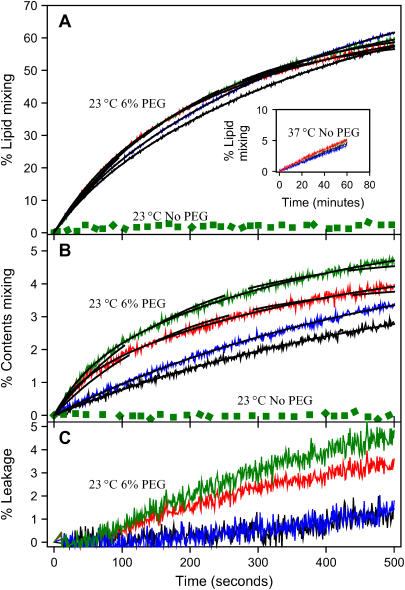
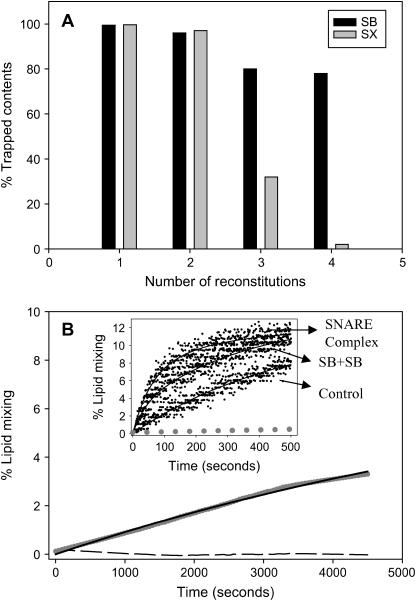
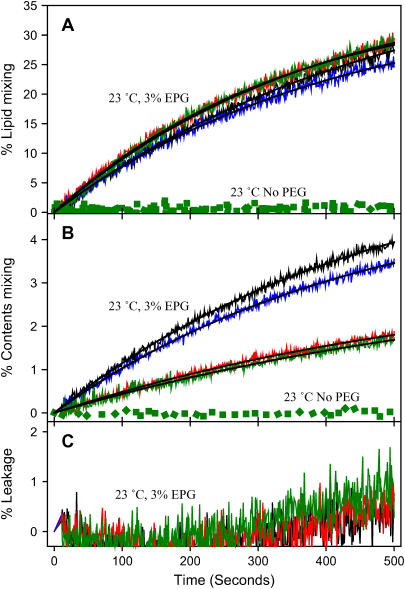
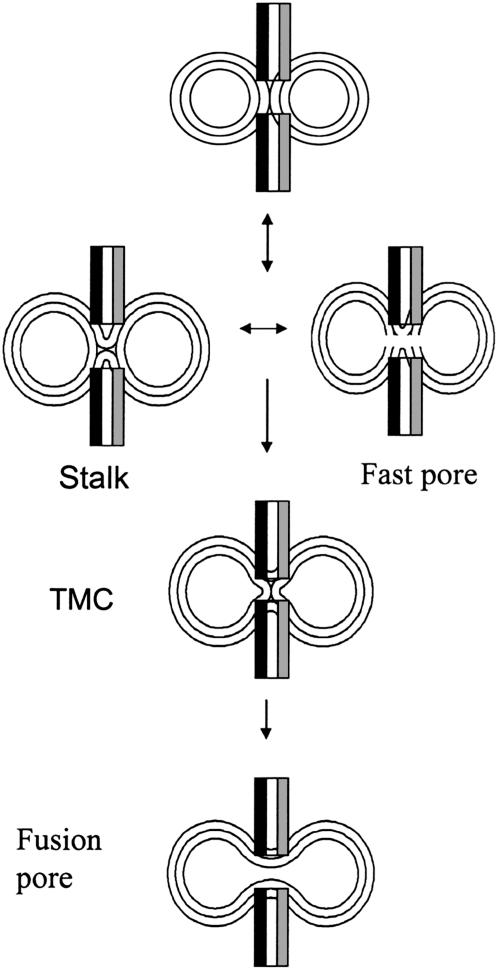
At low surface concentrations that permit formation of impermeable membranes, neuronal soluble N-ethyl maleimide sensitive factor attachment protein receptor (SNARE) proteins form a stable, parallel, trans complex when vesicles are brought into contact by a low concentration of poly(ethylene glycol) (PEG). Surprisingly, formation of a stable SNARE complex does not trigger fusion under these conditions. However, neuronal SNAREs do promote fusion at low protein/lipid ratios when triggered by higher concentrations of PEG. Promotion of PEG-triggered fusion required phosphatidylserine and depended only on the surface concentration of SNAREs and not on the formation of a trans SNARE complex. These results were obtained at protein surface concentrations reported for synaptobrevin in synaptic vesicles and with an optimally fusogenic lipid composition. At a much higher protein/lipid ratio, vesicles joined by SNARE complex slowly mixed lipids at 37 degrees C in the absence of PEG, in agreement with earlier reports. However, vesicles containing syntaxin at a high protein/lipid ratio (>or=1:250) lost membrane integrity. We conclude that the neuronal SNARE complex promotes fusion by joining membranes and that the individual proteins syntaxin and synaptobrevin disrupt membranes so as to favor formation of a stalk complex and to promote conversion of the stalk to a fusion pore. These effects are similar to the effects of viral fusion peptides and transmembrane domains, but they are not sufficient by themselves to produce fusion in our in vitro system at surface concentrations documented to occur in synaptic vesicles. Thus, it is likely that proteins or factors other than the SNARE complex must trigger fusion in vivo.
Figures
References
-
- Sollner, T., S. W. Whiteheart, M. Brunner, H. Erdjument-Bromage, S. Geromanos, P. Tempst, and J. E. Rothman. 1993. SNAP receptors implicated in vesicle targeting and fusion. Nature. 362:318–324. - PubMed
-
- Chen, Y. A., and R. H. Scheller. 2001. SNARE-mediated membrane fusion. Nat. Rev. Mol. Cell Biol. 2:98–106. - PubMed
-
- Lee, J., and B. R. Lentz. 1997. Evolution of lipidic structures during model membrane fusion and the relation of this process to cell membrane fusion. Biochemistry. 36:6251–6259. - PubMed
-
- Haque, M. E., T. J. McIntosch, and B. R. Lentz. 2001. Influence of lipid composition on physical properties and PEG-mediated fusion of curved and uncurved model membrane vesicles: “nature's own” fusogenic lipid bilayer. Biochemistry. 40:4340–4348. - PubMed
-
- Burgess, S. W., T. J. McIntosh, and B. R. Lentz. 1992. Modulation of poly(ethylene glycol)-induced fusion by membrane hydration: importance of interbilayer separation. Biochemistry. 31:2653–2661. - PubMed
Publication types
MeSH terms
Substances
Grants and funding
LinkOut - more resources
Full Text Sources
Other Literature Sources
