. 2005 Dec 20;102(51):18718-23.
doi: 10.1073/pnas.0505766102. Epub 2005 Dec 9.

Optical detection of rate-determining ion-modulated conformational changes of the ether-à-go-go K+ channel voltage sensor

Affiliations

Optical detection of rate-determining ion-modulated conformational changes of the ether-à-go-go K+ channel voltage sensor

John P A Bannister et al. Proc Natl Acad Sci U S A. .

Abstract

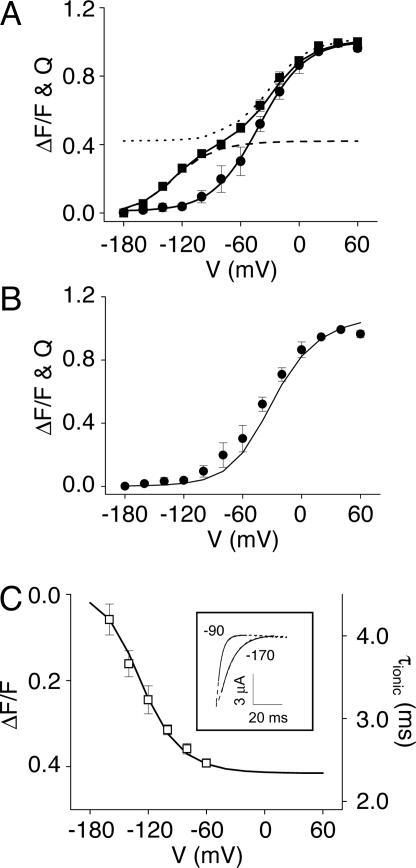
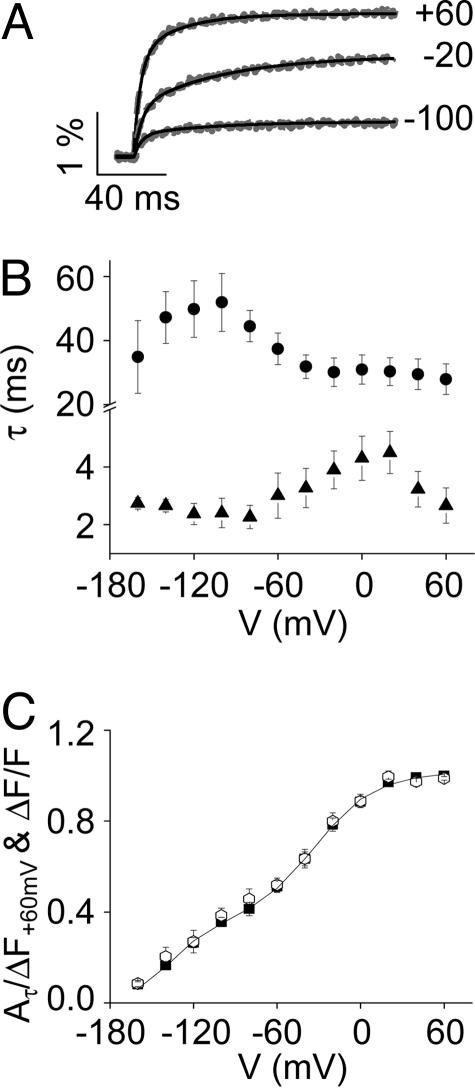
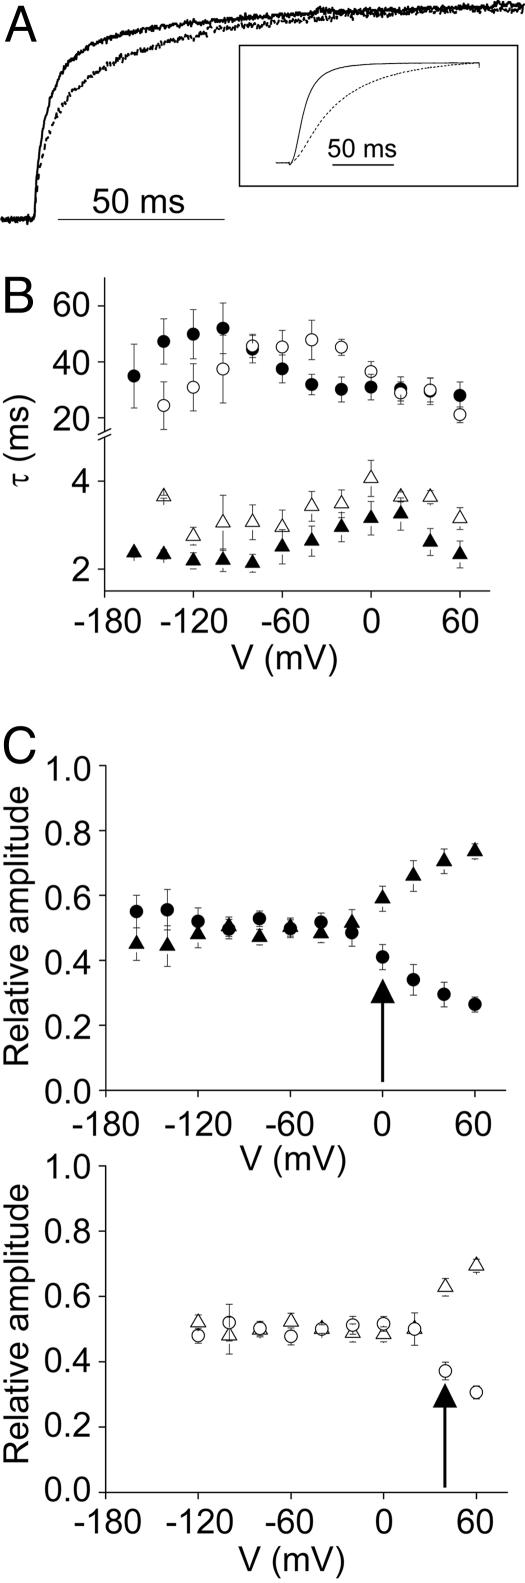
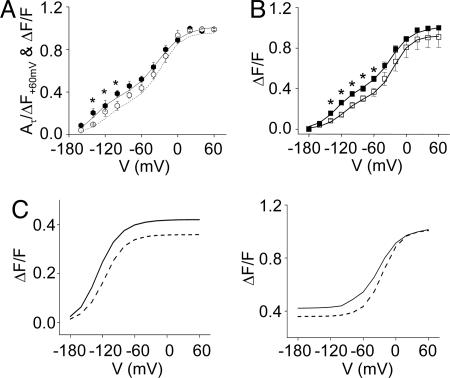
In voltage-dependent ether-à-go-go (eag) K+ channels, the process of activation is modulated by Mg2+ and other divalent cations, which bind to a site in the voltage sensor and slow channel opening. Previous analysis of eag ionic and gating currents indicated that Mg2+ has a much larger effect on ionic than gating current kinetics. From this, we hypothesized that ion binding modulates voltage sensor conformational changes that are poorly represented in gating current recordings. We have now tested this proposal by using a combined electrophysiological and optical approach. We find that a fluorescent probe attached near S4 in the voltage sensor reports on two phases of the activation process. One component of the optical signal corresponds to the main charge-moving conformational changes of the voltage sensor. This is the phase of activation that is well represented in gating current recordings. Another component of the optical signal reflects voltage sensor conformational changes that occur at more hyperpolarized potentials. These transitions, which are rate-determining for activation and highly modulated by Mg2+, have not been detected in gating current recordings. Our results demonstrate that the eag voltage sensor undergoes conformational changes that have gone undetected in electrical measurements. These transitions account for the time course of eag activation in the presence and absence of extracellular Mg2+.


Figures

Fig. 1.
Fig. 1.
Voltage-dependent ΔF/F signal from TMRM-L342C channels. (A) Schematic representation of eag, showing the approximate locations of the Mg2+-binding site (black circle) and the L342C mutation (gray circle) (17). Positively charged residues in S4 are indicated by “+.” (B) Ionic current (dashed) and ΔF/F traces (solid) were recorded simultaneously in the absence of extracellular Mg2+. After a 100-ms prepulse to -180 mV, the membrane was stepped to the indicated voltages for 150 ms. Representative data are shown. (C) (Upper) Gating current traces were recorded in the absence of Mg2+ by stepping from -180 mV to the indicated voltages. The arrows indicate the region integrated to obtain the time course of gating charge movement, shown at bottom. (Lower) Gating currents and ΔF/F were recorded simultaneously. The time course of gating charge movement (dashed) was overlaid with the ΔF/F trace (solid). The gating current and ΔF/F traces were scaled to the same amplitude at +40 mV, and this amplitude was used to normalize data obtained at other voltages. Representative data are shown. (D) Normalized steady-state G–V (diamonds), Q–V (circles), and ΔF/F–V (squares) curves were obtained in the absence of Mg2+. Solid lines represent fits of single (G–V and Q–V) or double (ΔF/F–V) Boltzman functions. Fitted values of V1/2 were -33 ± 3 mV and -3 ± 1 mV and apparent valences were 0.9 ± 0.1 and 1.5 ± 0.1 for the Q–V and G–V curves, respectively. Double Boltzmann fits of the ΔF/F–V data yielded V1/2 values of -130 ± 4 mV and -30 ± 3 mV for the hyperpolarized and depolarized components, respectively, and apparent valences of 0.8 ± 0.1 for both components. Data are presented as mean ± SEM, n = 4–9. If error bars are not visible, they are smaller than the size of the symbol.
Fig. 2.
Fig. 2.
Steady-state components of ΔF/F.(A) The fitted depolarized (dotted) and hyperpolarized (dashed) steady-state components of ΔF/F are shown, with the normalized ΔF/F–V (squares) and Q–V (circles) curves from Fig. 1D for comparison. (B) The normalized Q–V data points (circles) are compared with the fitted depolarized steady-state component of ΔF/F (solid line), which has been scaled to an amplitude of 1.0. Q–V data are presented as mean ± SEM, n = 4. (C)(Inset) Representative ionic currents (dashed) were recorded at +60 mV after prepulses to the indicated potentials. Values for τionic were determined from single exponential fits (solid lines). The main graph plots τionic (open squares) as a function of prepulse potential. For comparison, the fitted hyperpolarized steady-state component of ΔF/F (solid line) is also shown. Values of τionic are presented as mean ± SEM, n = 4. If error bars are not visible, they are smaller than the size of the symbol.
Fig. 3.
Fig. 3.
Kinetic components of ΔF/F.(A) ΔF/F traces (dashed gray lines) were obtained in the absence of Mg2+ by stepping from -180 mV to the indicated voltages, and fitted with two exponential components (solid black lines). Representative data are shown. (B) Fitted values of τslow (circles) and τfast (triangles), presented as mean ± SEM (n = 4–8), have been plotted versus test potential. (C) Values of AτF+60 mV (open symbols), presented as mean ± SEM (n = 8), have been plotted versus test potential. For comparison, the ΔF/F–V data points (filled symbols) and fitted curve (solid line) from Fig. 1D are also shown.
Fig. 4.
Fig. 4.
Mg2+ modulates ΔF/F kinetics. (A) (Inset) Representative TMRM-L342C ionic currents were recorded in the absence (solid) or presence (dashed) of 10 mM Mg2+ by stepping from -180 to 0 mV. Traces were scaled to the same amplitude. The main panel shows representative scaled ΔF/F traces, recorded in the absence (solid) or presence (dashed) of 10 mM Mg2+ by stepping from -180 to 0 mV. (B) Fitted values of τslow (circles) and τfast (triangles), obtained in the absence (filled symbols) or presence (open symbols) of 10 mM Mg2+, have been plotted versus test potential. Data are presented as mean ± SEM (n = 4–8). (C) Fitted relative amplitudes of the slow (Aslow, circles) and fast (Afast, triangles) kinetic components of ΔF/F were obtained in the absence (Upper) or presence (Lower) of Mg2+ and plotted versus test potential. The arrows indicate the voltages where the fast component becomes predominant. Data are presented as mean ± SEM (n = 4–8).
Fig. 5.
Fig. 5.
Comparison of the effect of Mg2+ on the kinetic and steady-state components of ΔF/F.(A) AτF+60 mV -V curves were obtained in the absence (filled circles) or presence (open circles) of Mg2+. Data are shown as mean ± SEM, n = 4–9 (*, P < 0.05, one-way ANOVA). For comparison, double Boltzman fits to the ΔF/F–V data obtained in the absence (solid line) or presence (dashed line) of Mg2+ are also shown (see B). (B) Normalized steady-state ΔF/F–V curves were obtained in the absence (filled squares) or presence (open squares) of Mg2+. Each curve was fitted by the sum of two Boltzmann functions (solid lines). In the presence of Mg2+, V1/2 values for the hyperpolarized and depolarized components were -108 ± 1.7 mV and -20 ± 0.1 mV, respectively. Both components had apparent valences of 0.7 ± 0.1. For fitted values of V1/2 and z in the absence of Mg2+, see Fig. 1 legend. Data are shown as mean ± SEM, n = 4–9 (*, P < 0.05, one-way ANOVA). (C) The fitted hyperpolarized (Left) and depolarized (Right) steady-state components of ΔF/F in the absence (solid line) and presence (dashed line) of Mg2+ are shown.
Fig. 6.
Fig. 6.
F/F)4 accounts for eag activation kinetics. (Insets) Representative normalized ΔF/F (dashed), ionic current (solid), and (ΔF/F)4 (dotted) traces were obtained in the absence (Left) or presence (Right) of 10 mM Mg2+ by pulsing from -180 to 0 mV. The maximum amplitudes of ΔF/F and I, obtained at the end of the records, were scaled to a value of 1.0 before calculating (ΔF/F)4. Shown are the same data as the Insets, but using an expanded time scale. The boxes highlight the complex sigmoidal kinetics of the initial activation of the ionic conductance.

Similar articles

Cited by

References

    1. Warmke, J., Drysdale, R. & Ganetzky, B. (1991) Science 252, 1560-1562. - PubMed
    1. Warmke, J. W. & Ganetzky, B. (1994) Proc. Natl. Acad. Sci. USA 91, 3438-3442. - PMC - PubMed
    1. Sanguinetti, M. C., Jiang, C., Curran, M. E. & Keating, M. T. (1995) Cell 81, 299-307. - PubMed
    1. Saganich, M. J., Machado, E. & Rudy, B. (2001) J. Neurosci. 21, 4609-4624. - PMC - PubMed
    1. Curran, M. E., Splawski, I., Timothy, K. W., Vincent, G. M., Green, E. D. & Keating, M. T. (1995) Cell 80, 795-803. - PubMed

Publication types

LinkOut - more resources