

Seasonal variation in food intake, physical activity, and body weight in a predominantly overweight population
- PMID: 16340952
- PMCID: PMC1428793
- DOI: 10.1038/sj.ejcn.1602346
Seasonal variation in food intake, physical activity, and body weight in a predominantly overweight population
Abstract
Objective: To describe seasonal variation in food intake, physical activity, and body weight in a predominantly overweight population.
Design: A longitudinal observational study.
Setting: Most of the study participants were recruited from a health maintenance organization (HMO) in central Massachusetts, USA. Additional individuals of Hispanic descent were recruited from outside of the HMO population to increase the ethnic diversity of this sample.
Subjects: Data from 593 participants, aged 20-70, were used for this investigation. Each participant was followed quarterly (five sampling points: baseline and four consecutive quarters) for 1-year period. Body weight measurements and three 24-h dietary and physical activity recalls were obtained on randomly selected days (including 2 weekdays and 1 weekend day) per quarter. Sinusoidal regression models were used to estimate peak-to-trough amplitude and phase of the peaks.
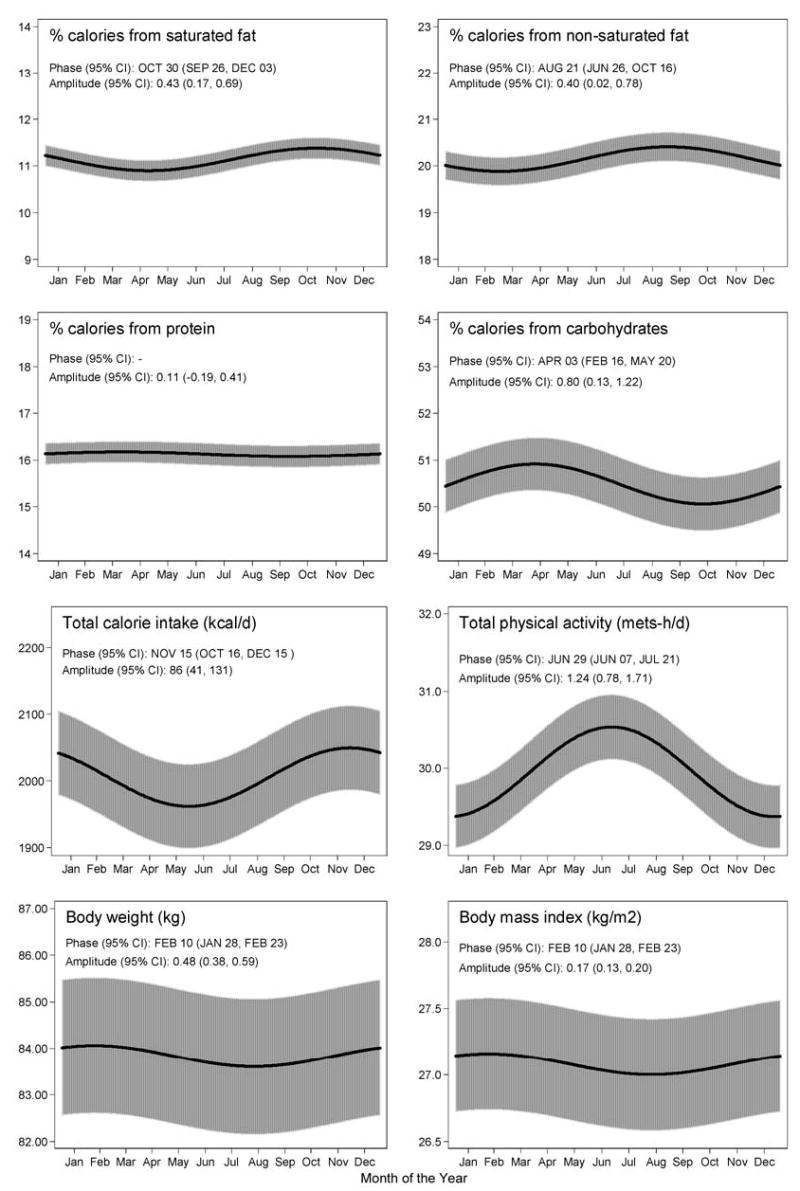
Results: Daily caloric intake was higher by 86 kcal/day during the fall compared to the spring. Percentage of calories from carbohydrate, fat and saturated fat showed slight seasonal variation, with a peak in the spring for carbohydrate and in the fall for total fat and saturated fat intake. The lowest physical activity level was observed in the winter and the highest in the spring. Body weight varied by about 1/2 kg throughout the year, with a peak in the winter (P<0.001 winter versus summer). Greater seasonal variation was observed in subjects who were male, middle aged, nonwhite, and less educated.
Conclusions: Although there is seasonal variation in diet, physical activity and body weight, the magnitude of the change is generally small in this population.
Sponsorship: US National Heart, Lung and Blood Institute.
Figures
References
-
- Ainsworth BE, Haskell WL, Whitt MC, Irwin ML, Swartz AM, Strath SJ, et al. Compendium of physical activities: an update of activity codes and MET intensities. Med Sci Sports Exerc. 2000;32 (Suppl):S498–S504. - PubMed
-
- Ball K, Crawford D. The obesity epidemic: contextual influences on physical activity and body weight. J Sci Med Sport. 2003;6:377–378. - PubMed
-
- Bergstralh EJ, Sinaki M, Offord KP, Wahner HW, Melton LJ., III Effect of season on physical activity score, back extensor muscle strength, and lumbar bone mineral density. J Bone Miner Res. 1990;5:371–377. - PubMed
-
- Brand-Miller J, Wolever TM, Foster-Powell K, Colagiuri S (2003). The New Glucose Revolution: The Authoritative Guide to the Glycemic Index–the Dietary Solution for Lifelong Health. Marlowe & Company: New York, NY.
-
- Cai H, Shu XO, Hebert JR, Jin F, Yang G, Liu DK, et al. Variation in nutrient intakes among women in Shanghai, China. Eur J Clin Nutr. 2004;58:1604–1611. - PubMed
