

In vivo delivery of fluoresceinated dextrans to the murine growth plate: imaging of three vascular routes by multiphoton microscopy
- PMID: 16342207
- PMCID: PMC2573993
- DOI: 10.1002/ar.a.20272
In vivo delivery of fluoresceinated dextrans to the murine growth plate: imaging of three vascular routes by multiphoton microscopy
Abstract
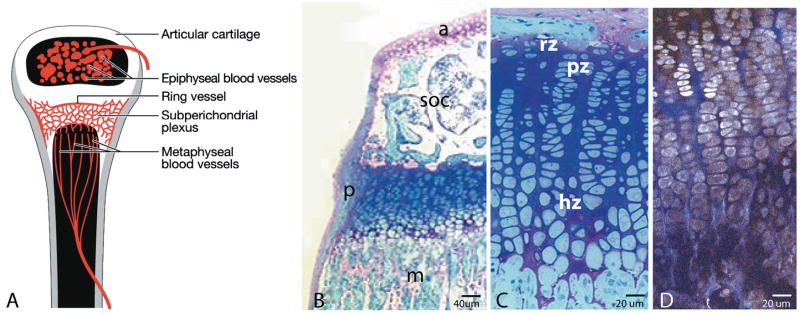
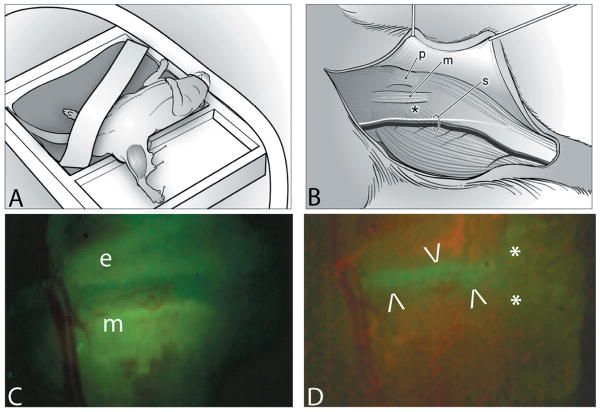
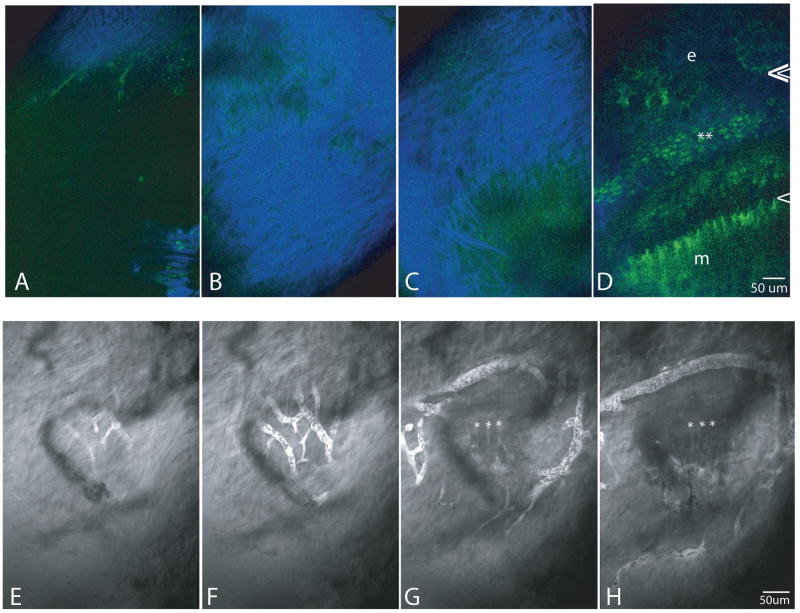
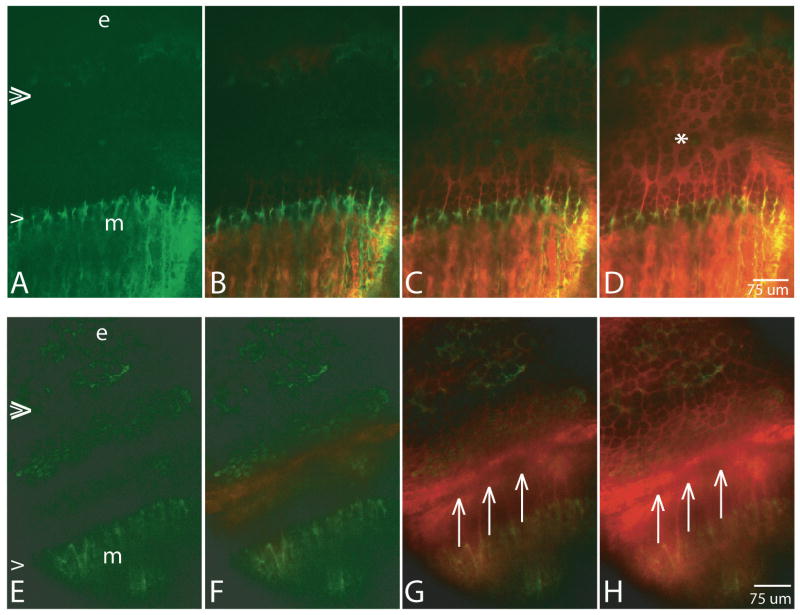
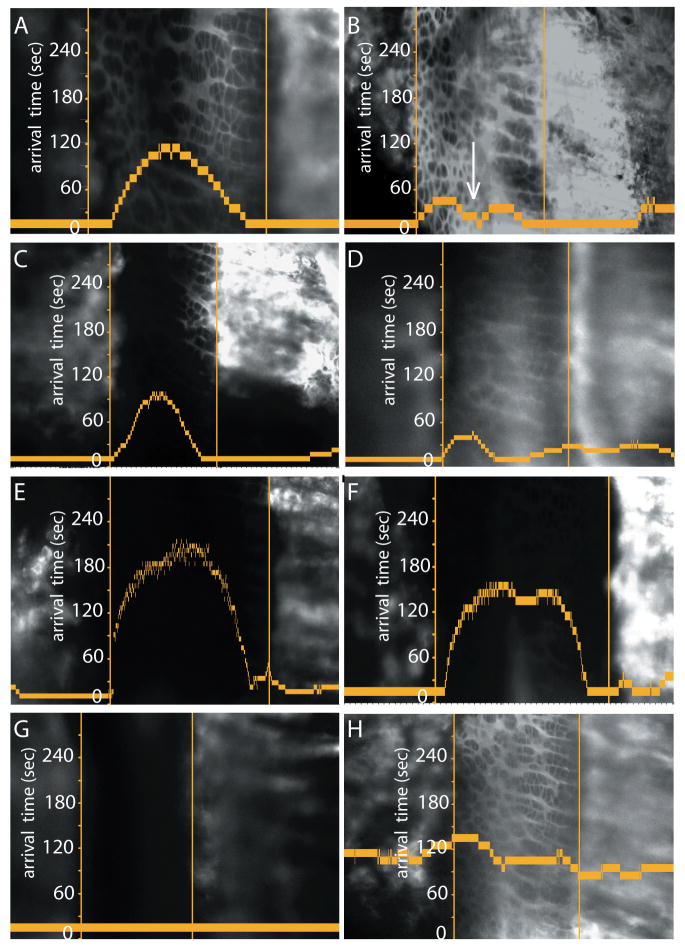
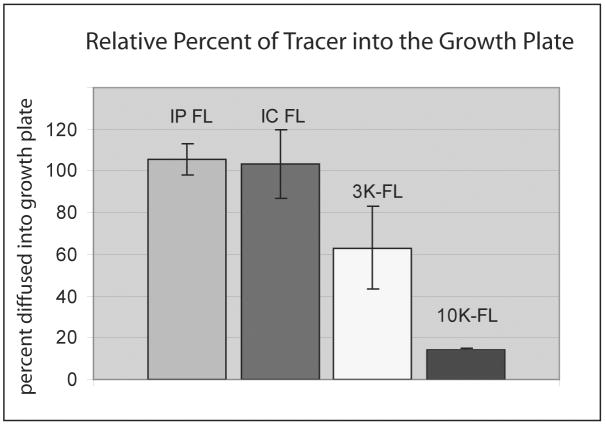
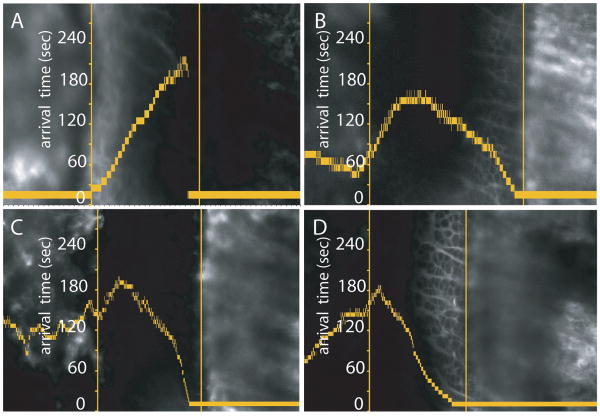
Bone elongation by endochondral ossification occurs through the differentiation cascade of chondrocytes of cartilaginous growth plates. Molecules from the systemic vasculature reach the growth plate from three different directions: epiphyseal, metaphyseal, and a ring vessel and plexus associated with the perichondrium. This study is an analysis of the real-time dynamics of entrance of fluoresceinated tracers of different molecular weights into the growth plate from the systemic vasculature and tests the hypothesis that molecular weight is a key variable in the determination of both the directionality and the extent of tracer movement into the growth plate. Multiphoton microscopy was used for direct in vivo imaging of the murine proximal tibial growth plate in anesthetized 4- to 5-week-old transgenic mice with green fluorescent protein linked to the collagen II promoter. Mice were given an intracardiac injection of either fluorescein (332.3 Da) or fluoresceinated dextrans of 3, 10, 40, 70 kDa, singly or sequentially. For each tracer, directionality and rate of arrival, together with extent of movement within the growth plate, were imaged in real time. For small molecules (up to 10 kDa), vascular access from all three directions was observed and entrance was equally permissive from the metaphyseal and the epiphyseal sides. Within our detection limit (a few percent of vascular concentration), 40 kDa and larger dextrans did not enter. These results have implications both for understanding systemic and paracrine regulation of growth plate chondrocytic differentiation, as well as variables associated with effective drug delivery to growth plate chondrocytes.
Figures
Similar articles
-
Hindlimb heating increases vascular access of large molecules to murine tibial growth plates measured by in vivo multiphoton imaging.J Appl Physiol (1985). 2014 Feb 15;116(4):425-38. doi: 10.1152/japplphysiol.01212.2013. Epub 2013 Dec 26. J Appl Physiol (1985). 2014. PMID: 24371019 Free PMC article.
-
Imaging IGF-I uptake in growth plate cartilage using in vivo multiphoton microscopy.J Appl Physiol (1985). 2017 Nov 1;123(5):1101-1109. doi: 10.1152/japplphysiol.00645.2017. Epub 2017 Aug 10. J Appl Physiol (1985). 2017. PMID: 28798204 Free PMC article.
-
Solute transport in growth plate cartilage: in vitro and in vivo.Biophys J. 2007 Aug 1;93(3):1039-50. doi: 10.1529/biophysj.106.097675. Epub 2007 May 11. Biophys J. 2007. PMID: 17496046 Free PMC article.
-
Review of the effects of anti-angiogenic compounds on the epiphyseal growth plate.Toxicol Pathol. 2006;34(2):131-47. doi: 10.1080/01926230600611836. Toxicol Pathol. 2006. PMID: 16537292 Review.
-
Recent Insights into Long Bone Development: Central Role of Hedgehog Signaling Pathway in Regulating Growth Plate.Int J Mol Sci. 2019 Nov 20;20(23):5840. doi: 10.3390/ijms20235840. Int J Mol Sci. 2019. PMID: 31757091 Free PMC article. Review.
Cited by
-
Long-Acting Growth Hormone Preparations - Current Status and Future Considerations.J Clin Endocrinol Metab. 2020 Jun 1;105(6):e2121-33. doi: 10.1210/clinem/dgz149. J Clin Endocrinol Metab. 2020. PMID: 31676901 Free PMC article. Review.
-
Hindlimb heating increases vascular access of large molecules to murine tibial growth plates measured by in vivo multiphoton imaging.J Appl Physiol (1985). 2014 Feb 15;116(4):425-38. doi: 10.1152/japplphysiol.01212.2013. Epub 2013 Dec 26. J Appl Physiol (1985). 2014. PMID: 24371019 Free PMC article.
-
Analysis of the orientation of primary cilia in growth plate cartilage: a mathematical method based on multiphoton microscopical images.J Struct Biol. 2007 Jun;158(3):293-306. doi: 10.1016/j.jsb.2006.11.004. Epub 2006 Nov 21. J Struct Biol. 2007. PMID: 17218113 Free PMC article.
-
The rationale and design of TransCon Growth Hormone for the treatment of growth hormone deficiency.Endocr Connect. 2017 Nov;6(8):R171-R181. doi: 10.1530/EC-17-0203. Epub 2017 Sep 25. Endocr Connect. 2017. PMID: 28947559 Free PMC article. Review.
-
Metabolic consideration of epiphyseal growth: survival responses in a taxing environment.Bone. 2007 Mar;40(3):561-7. doi: 10.1016/j.bone.2006.09.030. Epub 2006 Dec 8. Bone. 2007. PMID: 17157572 Free PMC article. Review.
References
-
- Aharinejad S, Marks SC, Jr, Böck P, MacKay CA, Larson E, Tahamtani A, Mason-Savas A, Firbas W. Microvascular pattern in the metaphysis during bone growth. Anat Rec. 1995;242:111–122. - PubMed
-
- Allen MR, Hock JM, Burr DB. Periosteum: biology, regulation, and response to osteoporosis therapies. Bone. 2004;35:1003–1012. - PubMed
-
- Aramoto H, Breslin JW, Pappas PJ, Hobson RW, Durán WN. Vascular endothelial growth factor stimulates differential signaling in in vivo microcirculation. Am J Physiol Heart Circ Physiol. 2004;287:H1590–H1598. - PubMed
-
- Arsenault AL. Microvascular organization at the epiphyseal-metaphyseal junction of growing rats. J Bone Miner Res. 1987;2:143–149. - PubMed
-
- Ballock RT, O'Keefe RJ. Current concepts review: the biology of the growth plate. J Bone Joint Surg. 2003;85-A:715–726. - PubMed
Publication types
MeSH terms
Substances
Grants and funding
LinkOut - more resources
Full Text Sources
Other Literature Sources
