Highly constrained backprojection for time-resolved MRI
- PMID: 16342275
- PMCID: PMC2366054
- DOI: 10.1002/mrm.20772
Highly constrained backprojection for time-resolved MRI
Abstract
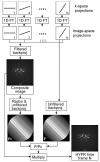
Recent work in k-t BLAST and undersampled projection angiography has emphasized the value of using training data sets obtained during the acquisition of a series of images. These techniques have used iterative algorithms guided by the training set information to reconstruct time frames sampled at well below the Nyquist limit. We present here a simple non-iterative unfiltered backprojection algorithm that incorporates the idea of a composite image consisting of portions or all of the acquired data to constrain the backprojection process. This significantly reduces streak artifacts and increases the overall SNR, permitting decreased numbers of projections to be used when acquiring each image in the image time series. For undersampled 2D projection imaging applications, such as cine phase contrast (PC) angiography, our results suggest that the angular undersampling factor, relative to Nyquist requirements, can be increased from the present factor of 4 to about 100 while increasing SNR per individual time frame. Results are presented for a contrast-enhanced PR HYPR TRICKS acquisition in a volunteer using an angular undersampling factor of 75 and a TRICKS temporal undersampling factor of 3 for an overall undersampling factor of 225.
Figures


Similar articles
-
Undersampled radial MR acquisition and highly constrained back projection (HYPR) reconstruction: potential medical imaging applications in the post-Nyquist era.J Magn Reson Imaging. 2009 Mar;29(3):501-16. doi: 10.1002/jmri.21683. J Magn Reson Imaging. 2009. PMID: 19243031 Review.
-
Iterative projection reconstruction of time-resolved images using highly-constrained back-projection (HYPR).Magn Reson Med. 2008 Jan;59(1):132-9. doi: 10.1002/mrm.21439. Magn Reson Med. 2008. PMID: 18058939
-
Rapid dynamic radial MRI via reference image enforced histogram constrained reconstruction.J Magn Reson. 2014 Mar;240:1-7. doi: 10.1016/j.jmr.2013.12.011. Epub 2014 Jan 9. J Magn Reson. 2014. PMID: 24486719
-
Improved waveform fidelity using local HYPR reconstruction (HYPR LR).Magn Reson Med. 2008 Mar;59(3):456-62. doi: 10.1002/mrm.21505. Magn Reson Med. 2008. PMID: 18306397 Free PMC article.
-
Time-resolved angiography: Past, present, and future.J Magn Reson Imaging. 2012 Dec;36(6):1273-86. doi: 10.1002/jmri.23646. Epub 2012 May 7. J Magn Reson Imaging. 2012. PMID: 22566099 Review.
Cited by
-
Location constrained approximate message passing for compressed sensing MRI.Magn Reson Med. 2013 Aug;70(2):370-81. doi: 10.1002/mrm.24468. Epub 2012 Oct 5. Magn Reson Med. 2013. PMID: 23042658 Free PMC article.
-
Respiratory motion-compensated radial dynamic contrast-enhanced (DCE)-MRI of chest and abdominal lesions.Magn Reson Med. 2008 Nov;60(5):1135-46. doi: 10.1002/mrm.21740. Magn Reson Med. 2008. PMID: 18956465 Free PMC article.
-
Improved quantification of myocardial blood flow using highly constrained back projection reconstruction.Magn Reson Med. 2014 Sep;72(3):749-55. doi: 10.1002/mrm.24958. Epub 2013 Oct 1. Magn Reson Med. 2014. PMID: 24122950 Free PMC article.
-
High-resolution dynamic speech imaging with joint low-rank and sparsity constraints.Magn Reson Med. 2015 May;73(5):1820-32. doi: 10.1002/mrm.25302. Epub 2014 Jun 9. Magn Reson Med. 2015. PMID: 24912452 Free PMC article.
-
Bayesian framework inspired no-reference region-of-interest quality measure for brain MRI images.J Med Imaging (Bellingham). 2017 Apr;4(2):025504. doi: 10.1117/1.JMI.4.2.025504. Epub 2017 Jun 13. J Med Imaging (Bellingham). 2017. PMID: 28630885 Free PMC article.
References
-
- Peters DC, Grist TM, Korosec FR, Holden JE, Block WF, Wedding KL, Carroll TJ, Mistretta CA. Undersampled projection reconstruction applied to MR angiography. Magn Reson Med. 2000;43:91–101. - PubMed
-
- Vigen KK, Peters DC, Grist TM, Block WF, Mistretta CA. Undersampled projection-reconstruction imaging for time-resolved contrast-enhanced imaging. Magn Reson Med. 2000;43:170–176. - PubMed
-
- Barger AV, Block WF, Toropov Y, Grist TM, Mistretta CA. Time-resolved contrast-enhanced imaging with isotropic resolution and broad coverage using an undersampled 3D projection trajectory. Magn Reson Med. 2002;48:297–305. - PubMed
-
- Johnson K, Gu T, Mistretta CA. 4D pressure mapping with time-resolved PC VIPR. ISMRM; Miami, Florida: 2005. Abstract 598.
Publication types
MeSH terms
Grants and funding
LinkOut - more resources
Full Text Sources
Other Literature Sources
Medical
Research Materials

