. 2006 Jan;16(1):1-10.
doi: 10.1101/gr.4222606. Epub 2005 Dec 12.

Comprehensive analysis of transcriptional promoter structure and function in 1% of the human genome

Affiliations

Comprehensive analysis of transcriptional promoter structure and function in 1% of the human genome

Sara J Cooper et al. Genome Res. 2006 Jan.

Abstract

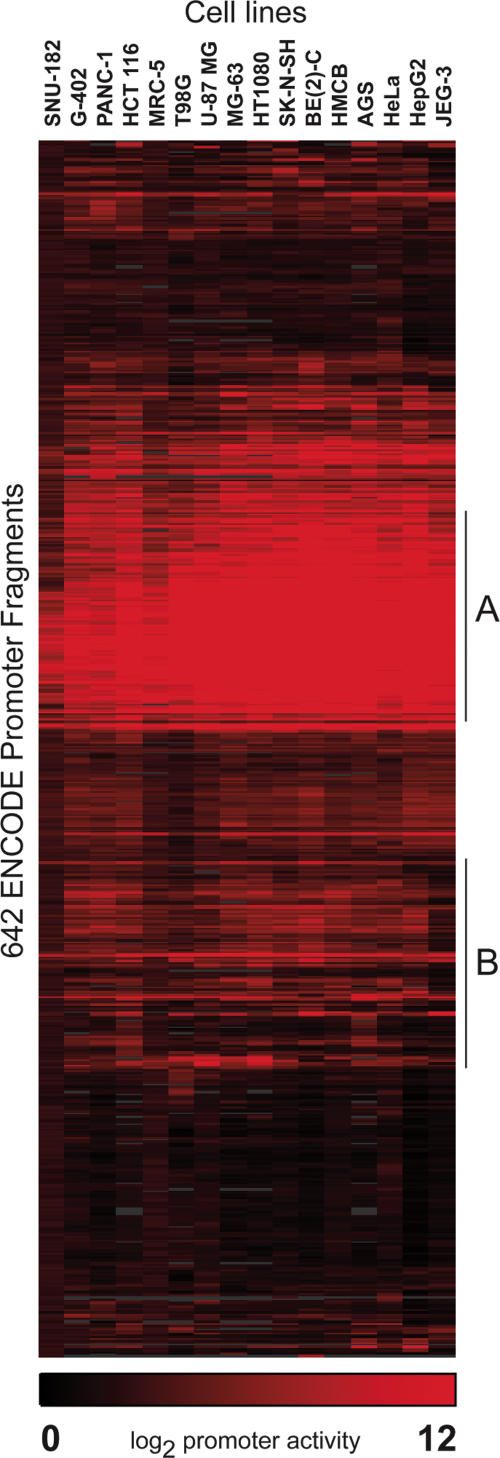
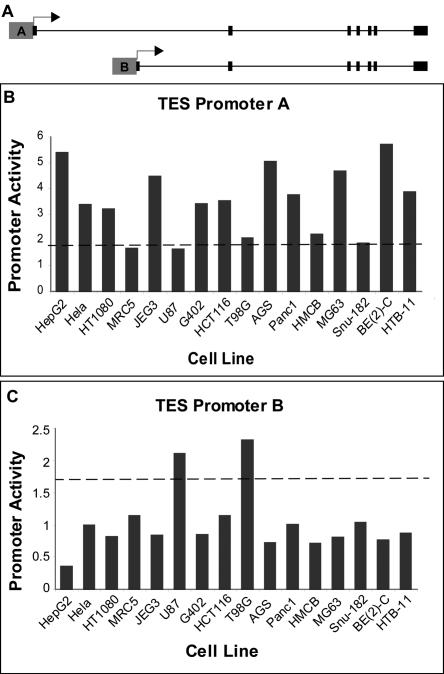
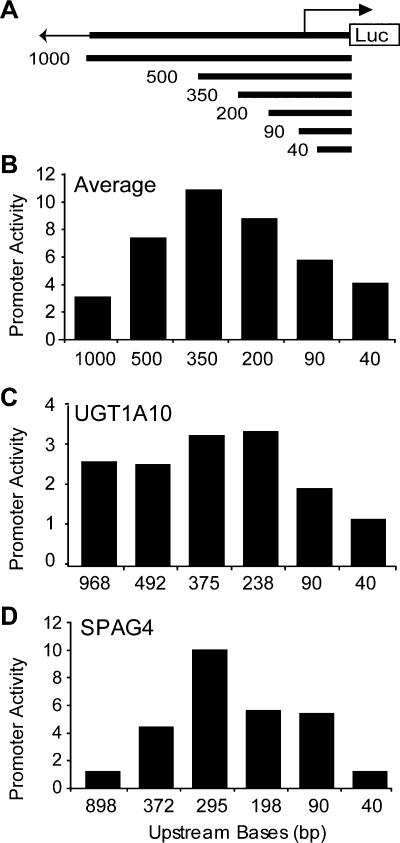
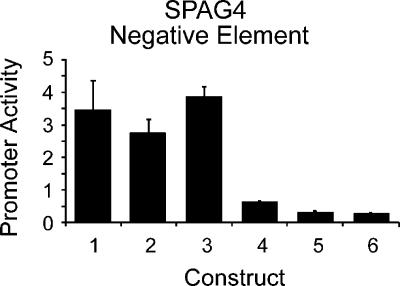
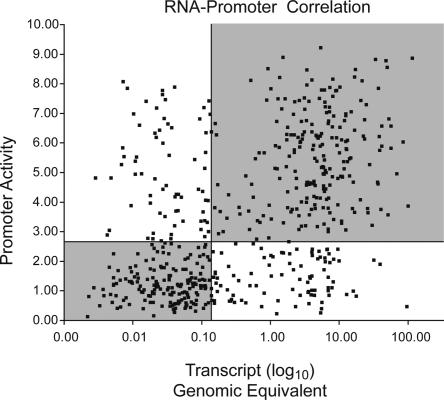
Transcriptional promoters comprise one of many classes of eukaryotic transcriptional regulatory elements. Identification and characterization of these elements are vital to understanding the complex network of human gene regulation. Using full-length cDNA sequences to identify transcription start sites (TSS), we predicted more than 900 putative human transcriptional promoters in the ENCODE regions, representing a comprehensive sampling of promoters in 1% of the genome. We identified 387 fragments that function as promoters in at least one of 16 cell lines by measuring promoter activity in high-throughput transient transfection reporter assays. These positive functional results demonstrate widespread use of alternative promoters. We show a strong correlation between promoter activity and the corresponding endogenous RNA transcript levels, providing the first experimental quantitative estimate of promoter contribution to gene regulation. Finally, we identified functional regions within a randomly selected subset of 45 promoters using deletion analyses. These experiments showed that, on average, the sequence -300 to -50 bp of the TSS positively contributes to core promoter activity. Interestingly, putative negative elements were identified -1000 to -500 bp upstream of the TSS for 55% of genes tested. These data provide the largest and most comprehensive view of promoter function in the human genome.


Figures

Figure 1.
Figure 1.
Clustergram of 642 putative promoter fragments. The clustergram illustrates the hierarchical clustering of promoter activity among 16 diverse cell lines. Each row indicates the promoter activity of a fragment in each of the cell lines, with red indicating the degree of activity and black indicating no activity. Promoter activity has been normalized and log transformed to reflect comparable values between cell lines. Area A represents a cluster of promoter fragments with strong, ubiquitous activity in all cell lines and area B represents a cluster of promoter fragments that exhibit variable function across the 16 cell types.
Figure 2.
Figure 2.
Two promoters differentially regulate testin gene. (A) Gene structure of testin (TES) gene. (B,C) Promoter activity for promoters of the TES gene in 16 tested cell types represented as a transformed firefly luciferase/Renilla luciferase ratio. (B) Promoter A shows activity in 12 of the 16 tissues but little activity in two brain cell lines, U87 and T98G. (C) Promoter B has significant activity only in U87 and T98G, both brain cell lines.
Figure 3.
Figure 3.
Reporter activity of promoter deletion constructs. (A) Diagram of promoter deletion constructs. (B) Average promoter activity observed for each of the 6 constructs of decreasing upstream sequence (1000 bp, 500 bp, 350 bp, 200 bp, 90 bp, 40 bp). The average represents normalized activity of constructs in 45 promoters and seven cell lines (HT1080, HeLa, HCT116, G-402, AGS, T98G, and JEG3). The promoter activity, assayed in triplicate and represented as normalized firefly luciferase/Renilla luciferase ratio, provides a transfection-normalized value to compare activity within and between cell lines. (C) Average activities of promoter fragments for the UDP glycosyltransferase gene (UGT1A10) across seven cell types. (D) Average activities of sperm-associated antigen 4 (SPAG4) promoter fragments across seven cell types. The 898-bp fragment of the SPAG4 promoter shows considerably less activity than the 372-bp fragment.
Figure 4.
Figure 4.
Negative regulatory element in SPAG4 promoter. Average promoter activity across two cell types, HT1080 and HCT116, of six constructs: Construct 1, SPAG4 372-bp fragment; Construct 2, SPAG4 372-bp promoter cloned in tandem duplicate to control for size; Construct 3, 500 bp of random sequence cloned upstream of the SPAG4 372-bp promoter; Construct 4, SPAG4 898-bp fragment; Construct 5, SPAG4 -898 to -372 fragment cloned upstream of heterologous promoter A; Construct 6, SPAG4 -898→372 fragment upstream of heterologous promoter B. Error bars indicate one standard deviation from the mean of four replicates of each construct.
Figure 5.
Figure 5.
Scatterplot of endogenous RNA transcript levels versus promoter activity. RNA levels, expressed as absolute genomic equivalents, are plotted on the x-axis and the normalized promoter activity is shown on the y-axis. We calculated the correlation coefficient, r = 0.53. (R2 = 0.28). Quadrants' boundaries are set by the median RNA transcript level (0.17 genomic equivalents) and median promoter activity (2.69 firefly luciferase/Renilla luciferase ratio).

References

    1. Ahituv, N., Rubin, E.M., and Nobrega, M.A. 2004. Exploiting human-fish genome comparisons for deciphering gene regulation. Hum. Mol. Genet. 13 Spec No 2: R261-R266. - PubMed
    1. Bailey, T.L. and Elkan, C. 1994. Fitting a mixture model by expectation maximization to discover motifs in biopolymers. Proc. Int. Conf. Intell. Syst. Mol. Biol. 2 28-36. - PubMed
    1. Bertone, P., Stolc, V., Royce, T.E., Rozowsky, J.S., Urban, A.E., Zhu, X., Rinn, J.L., Tongprasit, W., Samanta, M., Weissman, S., et al. 2004. Global identification of human transcribed sequences with genome tiling arrays. Science 306 2242-2246. - PubMed
    1. Blais, A. and Dynlacht, B.D. 2004. Hitting their targets: An emerging picture of E2F and cell cycle control. Curr. Opin. Genet. Dev. 14 527-532. - PubMed
    1. Brudno, M., Do, C.B., Cooper, G.M., Kim, M.F., Davydov, E., Green, E.D., Sidow, A., and Batzoglou, S. 2003. LAGAN and Multi-LAGAN: Efficient tools for large-scale multiple alignment of genomic DNA. Genome Res. 13 721-731. - PMC - PubMed

Web site references

    1. http://genome.ucsc.edu/ENCODE; ENCODE.

Publication types

MeSH terms

LinkOut - more resources