. 2006 Jan;16(1):106-14.
doi: 10.1101/gr.4319006. Epub 2005 Dec 12.

Variation in crossing-over rates across chromosome 4 of Arabidopsis thaliana reveals the presence of meiotic recombination "hot spots"

Affiliations

Variation in crossing-over rates across chromosome 4 of Arabidopsis thaliana reveals the presence of meiotic recombination "hot spots"

Jan Drouaud et al. Genome Res. 2006 Jan.

Abstract

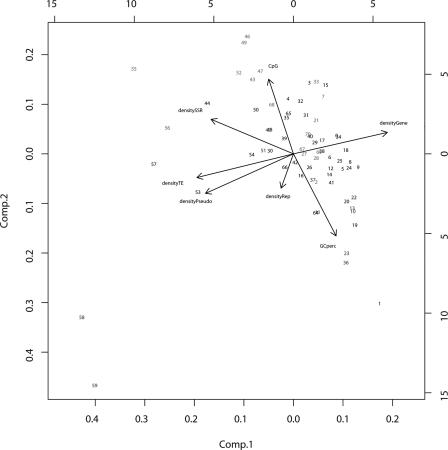
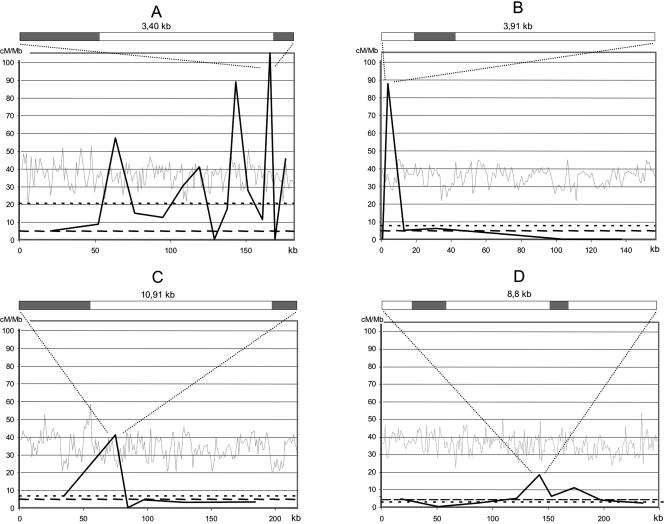
Crossover (CO) is a key process for the accurate segregation of homologous chromosomes during the first meiotic division. In most eukaryotes, meiotic recombination is not homogeneous along the chromosomes, suggesting a tight control of the location of recombination events. We genotyped 71 single nucleotide polymorphisms (SNPs) covering the entire chromosome 4 of Arabidopsis thaliana on 702 F2 plants, representing 1404 meioses and allowing the detection of 1171 COs, to study CO localization in a higher plant. The genetic recombination rates varied along the chromosome from 0 cM/Mb near the centromere to 20 cM/Mb on the short arm next to the NOR region, with a chromosome average of 4.6 cM/Mb. Principal component analysis showed that CO rates negatively correlate with the G+C content (P = 3x10(-4)), in contrast to that reported in other eukaryotes. COs also significantly correlate with the density of single repeats and the CpG ratio, but not with genes, pseudogenes, transposable elements, or dispersed repeats. Chromosome 4 has, on average, 1.6 COs per meiosis, and these COs are subjected to interference. A detailed analysis of several regions having high CO rates revealed "hot spots" of meiotic recombination contained in small fragments of a few kilobases. Both the intensity and the density of these hot spots explain the variation of CO rates along the chromosome.


Figures

Figure 1.
Figure 1.
Variation of the CO rates on chromosome 4 of A. thaliana. The numbers refer to the intervals given in Supplemental Table 2. The dotted line represents the average CO rate on chromosome 4 (4.6 cM/Mb). A schematic representation of chromosome 4 of A. thaliana is aligned with the diagram. (Black box) NOR (nucleolar organizer region), (gray box) heterochromatic knob, (diamond-shaped box) centromere.
Figure 2.
Figure 2.
Principal component analysis of chromosome 4 of A. thaliana. Numbers refer to the intervals given in Figure 1 and Supplemental Table 2. Hot intervals are indicated in red; cold intervals are indicated in blue.
Figure 3.
Figure 3.
Number of CO events per chromatid deduced from the genotype of an F2 plant. When an F2 plant displays two COs, either the extremities of both chromosomes are homozygous, and the COs are on one chromatid or both, or the extremities are heterozygous and there is ambiguity between one event on each chromatid or two events on the same chromatid. A similar approach has been used to analyse F2 plants that displays three COs. When an F2 plant displays more than three COs, the recombination history cannot be inferred from the genotype. In the columns “COs/chromatid,” the numbers in parentheses represent the number of plants in each category. (Light gray box) plants used in the interference analysis. (Dark gray box) plants containing a chromatid with two COs but that could not be used in the interference analysis.
Figure 4.
Figure 4.
Distribution of the distances in centiMorgans between double COs. (Histogram in black) observed distribution of double COs in our F2 (see text); (histogram in gray) theoretical distribution of double COs if the position of one CO is independent of the second (Methods).
Figure 5.
Figure 5.
Fine-scale analysis of the distribution of CO breakpoints in four intervals. (A) interval 70: 44.5kb-3; 16.4kb-2; 6.2kb-5; 19.5kb-4; 17.5kb-3; 9.4kb-4; 12.3kb-7; 8.1kb-0; 8.3kb-2; 3.2kb-4; 13.0kb-5; 6.4kb-1; 3.4kb-5; 3.3kb-0; 11.0kb-7. (B) interval 21: 2.5kb-0; 3.9kb-5; 13.8kb-1; 23.6kb-2; 45.7kb-2; 29.2kb-0; 38.6kb-0. (C) interval 57: 69.5kb-6; 12.2kb-7; 7.1kb-0; 17.4kb-1; 46.5kb-2; 65.0kb-3. (D) interval 37: 35.2kb-2; 32.7kb-0; 38.1kb-1; 8.8kb-2; 12.6kb-1; 28.3kb-1; 20.2kb-1; 49.2kb-2; 38.7kb-1. For each interval the size of each DNA fragment is given and the number of recombinant plants. (Light gray line) G+C content calculated in 1-kb windows. (Black line) CO rates in centiMorgans per megabase. (Small dotted line) interval COs rate average. (Large dotted line) chromosome 4 COs rate average. Above each major peak is the gene organization of the fragment. (Gray box) gene.

Similar articles

Cited by

References

    1. Anderson, L.K. and Stack, S.M. 2002. Meiotic recombination in plants. Curr. Genomics 3 507-525.
    1. The Arabidopsis Genome Initiative. 2000. Analysis of the genome sequence of the flowering plant Arabidopsis thaliana. Nature 408 796-815. - PubMed
    1. Baudat, F. and Nicolas, A. 1997. Clustering of meiotic double-strand breaks on yeast chromosome III. Proc. Natl. Acad. Sci. 94 5213-5218. - PMC - PubMed
    1. Benson, G. 1999. Tandem repeats finder: A program to analyze DNA sequences. Nucleic Acids Res. 27 573-580. - PMC - PubMed
    1. Birdsell, J.A. 2002. Integrating genomics, bioinformatics, and classical genetics to study the effects of recombination on genome evolution. Mol. Biol. Evol. 19 1181-1197. - PubMed

Web site references

    1. http://www.arabidopsis.org/; The Arabidopsis information resource.
    1. http://ftp.tigr.org/pub/data/a_thaliana/ath1/; Arabidopsis sequence database.
    1. http://cran.r-project.org; R software.

Publication types

MeSH terms