

Molecular characterization of the cytotoxic mechanism of multiwall carbon nanotubes and nano-onions on human skin fibroblast
- PMID: 16351195
- PMCID: PMC2733876
- DOI: 10.1021/nl051748o
Molecular characterization of the cytotoxic mechanism of multiwall carbon nanotubes and nano-onions on human skin fibroblast
Abstract
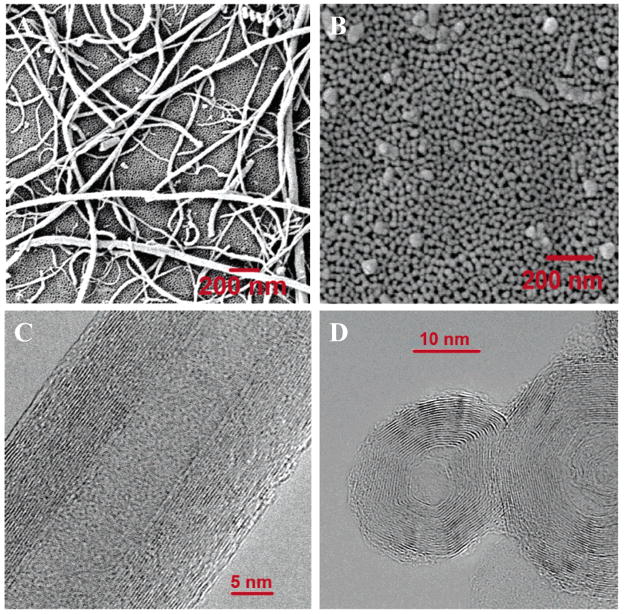
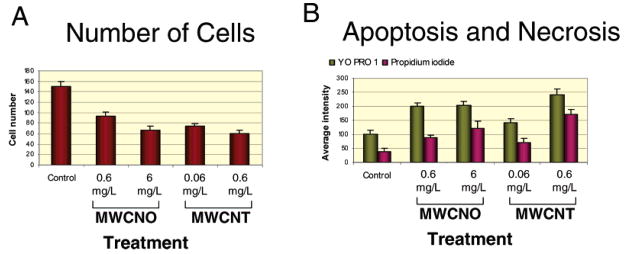
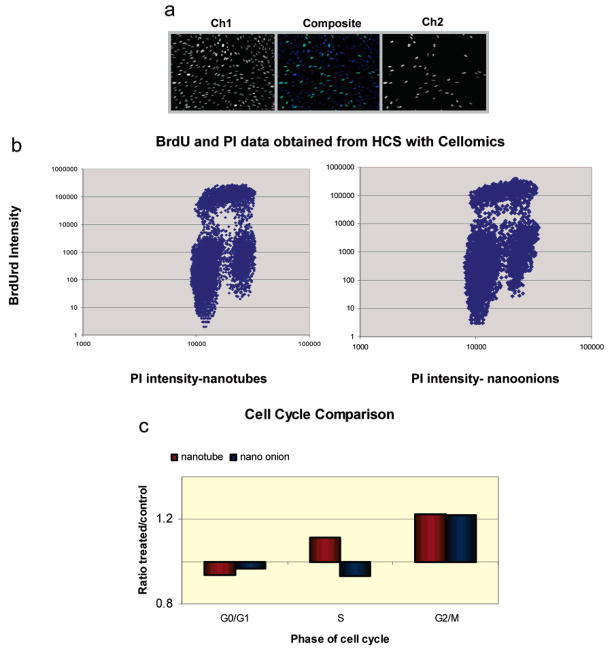
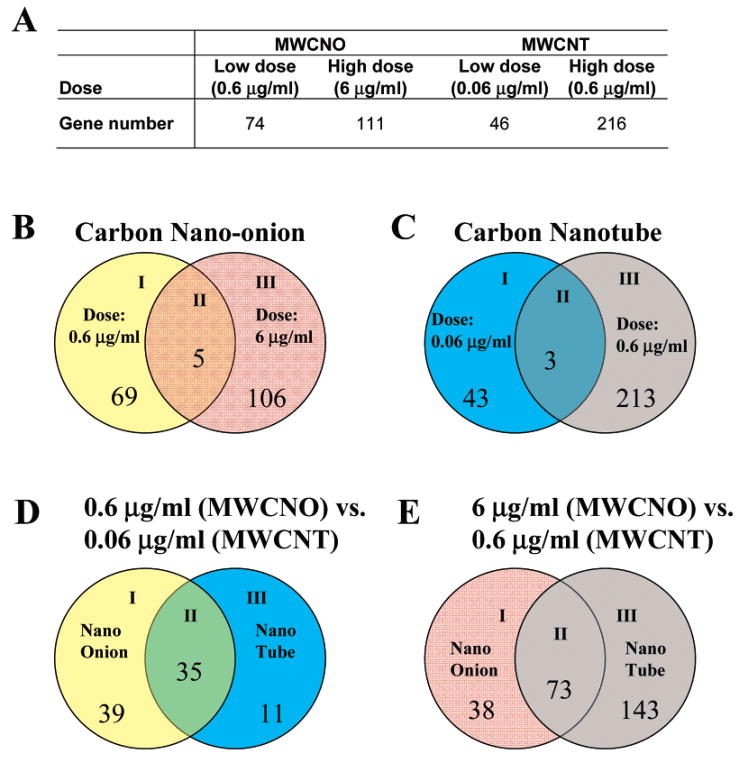
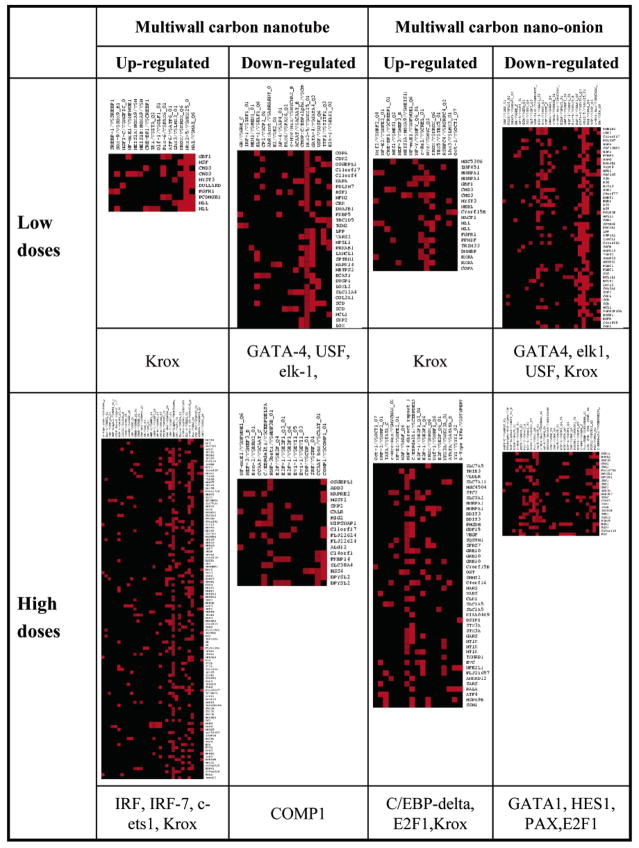
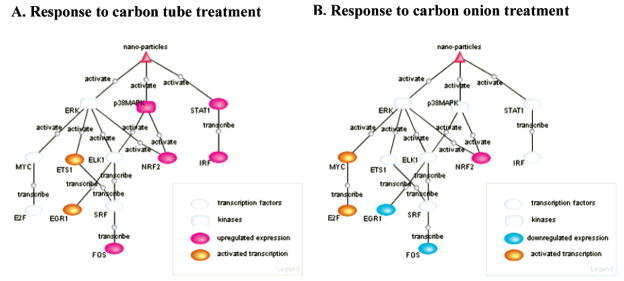
The increasing use of nanotechnology in consumer products and medical applications underlies the importance of understanding its potential toxic effects to people and the environment. Although both fullerene and carbon nanotubes have been demonstrated to accumulate to cytotoxic levels within organs of various animal models and cell types and carbon nanomaterials have been exploited for cancer therapies, the molecular and cellular mechanisms for cytotoxicity of this class of nanomaterial are not yet fully apparent. To address this question, we have performed whole genome expression array analysis and high content image analysis based phenotypic measurements on human skin fibroblast cell populations exposed to multiwall carbon nano-onions (MWCNOs) and multiwall carbon nanotubes (MWCNTs). Here we demonstrate that exposing cells to MWCNOs and MWCNTs at cytotoxic doses induces cell cycle arrest and increases apoptosis/necrosis. Expression array analysis indicates that multiple cellular pathways are perturbed after exposure to these nanomaterials at these doses, with material-specific toxigenomic profiles observed. Moreover, there are also distinct qualitative and quantitative differences in gene expression profiles, with each material at different dosage levels (6 and 0.6 microg/mL for MWCNO and 0.6 and 0.06 microg/mL for MWCNT). MWCNO and MWCNT exposure activates genes involved in cellular transport, metabolism, cell cycle regulation, and stress response. MWCNTs induce genes indicative of a strong immune and inflammatory response within skin fibroblasts, while MWCNO changes are concentrated in genes induced in response to external stimuli. Promoter analysis of the microarray results demonstrate that interferon and p38/ERK-MAPK cascades are critical pathway components in the induced signal transduction contributing to the more adverse effects observed upon exposure to MWCNTs as compared to MWCNOs.
Figures
Similar articles
-
Single-walled carbon nanotubes (SWCNTs) inhibit heat shock protein 90 (HSP90) signaling in human lung fibroblasts and keratinocytes.Toxicol Appl Pharmacol. 2017 Aug 15;329:347-357. doi: 10.1016/j.taap.2017.06.024. Epub 2017 Jul 1. Toxicol Appl Pharmacol. 2017. PMID: 28673683
-
TIMP1 promotes multi-walled carbon nanotube-induced lung fibrosis by stimulating fibroblast activation and proliferation.Nanotoxicology. 2017 Feb;11(1):41-51. doi: 10.1080/17435390.2016.1262919. Epub 2016 Dec 9. Nanotoxicology. 2017. PMID: 27852133 Free PMC article.
-
Nano-risk Science: application of toxicogenomics in an adverse outcome pathway framework for risk assessment of multi-walled carbon nanotubes.Part Fibre Toxicol. 2016 Mar 15;13:15. doi: 10.1186/s12989-016-0125-9. Part Fibre Toxicol. 2016. PMID: 26979667 Free PMC article.
-
Determination of cytotoxicity attributed to multiwall carbon nanotubes (MWCNT) in normal human embryonic lung cell (WI-38) line.J Toxicol Environ Health A. 2010;73(21-22):1521-9. doi: 10.1080/15287394.2010.511577. J Toxicol Environ Health A. 2010. PMID: 20954078
-
Mechanisms of lung fibrosis induced by carbon nanotubes: towards an Adverse Outcome Pathway (AOP).Part Fibre Toxicol. 2016 Feb 29;13:11. doi: 10.1186/s12989-016-0123-y. Part Fibre Toxicol. 2016. PMID: 26926090 Free PMC article. Review.
Cited by
-
Functionalized Lanthanide Oxide Nanoparticles for Tumor Targeting, Medical Imaging, and Therapy.Pharmaceutics. 2021 Nov 8;13(11):1890. doi: 10.3390/pharmaceutics13111890. Pharmaceutics. 2021. PMID: 34834305 Free PMC article. Review.
-
Mechanistic understanding of toxicity from nanocatalysts.Int J Mol Sci. 2014 Aug 12;15(8):13967-92. doi: 10.3390/ijms150813967. Int J Mol Sci. 2014. PMID: 25119861 Free PMC article. Review.
-
Diamond thin films: giving biomedical applications a new shine.J R Soc Interface. 2017 Sep;14(134):20170382. doi: 10.1098/rsif.2017.0382. J R Soc Interface. 2017. PMID: 28931637 Free PMC article. Review.
-
Biopersistence and potential adverse health impacts of fibrous nanomaterials: what have we learned from asbestos?Wiley Interdiscip Rev Nanomed Nanobiotechnol. 2009 Sep-Oct;1(5):511-29. doi: 10.1002/wnan.41. Wiley Interdiscip Rev Nanomed Nanobiotechnol. 2009. PMID: 20049814 Free PMC article. Review.
-
Carbon Nanotubes in Biology and Medicine: In vitro and in vivo Detection, Imaging and Drug Delivery.Nano Res. 2009 Feb 1;2(2):85-120. doi: 10.1007/s12274-009-9009-8. Nano Res. 2009. PMID: 20174481 Free PMC article.
References
-
- Colvin VL. The potential environmental impact of engineered nanomaterials. Nat Biotechnol. 2003;21:1166–1170. - PubMed
-
- Service RF. American Chemical Society meeting. Nanomaterials show signs of toxicity. Science. 2003;300:243. - PubMed
-
- Proffitt F. Nanotechnology. Yellow light for nanotech. Science. 2004;305:762. - PubMed
-
- Service RF. Nanotoxicology. Nanotechnology grows up. Science. 2004;304:1732–1734. - PubMed
-
- Curl RFRES, Kroto HW, O’Brien S, Heath JR. How the news that we were not the first to conceive of soccer ball C60 got to us. J Mol Graphics Modell. 2001;19:185–186. - PubMed
Publication types
MeSH terms
Substances
Grants and funding
LinkOut - more resources
Full Text Sources
Other Literature Sources
Miscellaneous
