Meta-Analysis
. 2005 Nov;131(6):856-97.
doi: 10.1037/0033-2909.131.6.856.

A test of major assumptions about behavior change: a comprehensive look at the effects of passive and active HIV-prevention interventions since the beginning of the epidemic

Affiliations
Meta-Analysis

A test of major assumptions about behavior change: a comprehensive look at the effects of passive and active HIV-prevention interventions since the beginning of the epidemic

Dolores Albarracín et al. Psychol Bull. 2005 Nov.

Abstract

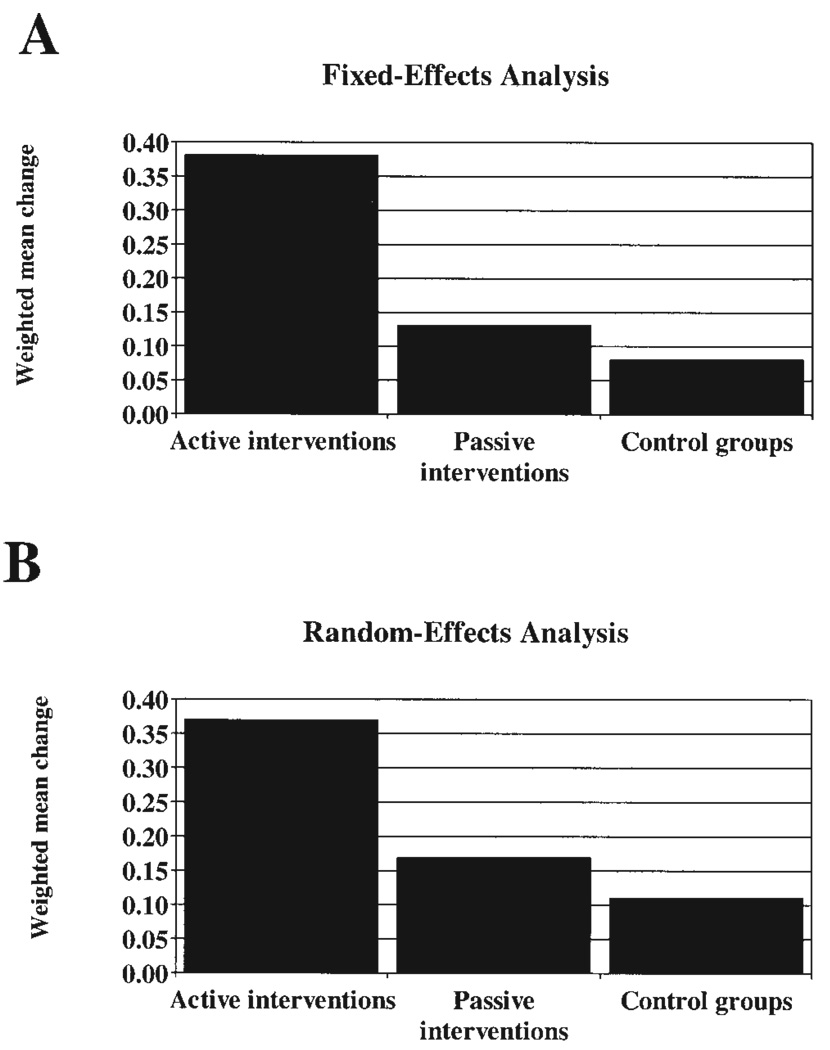
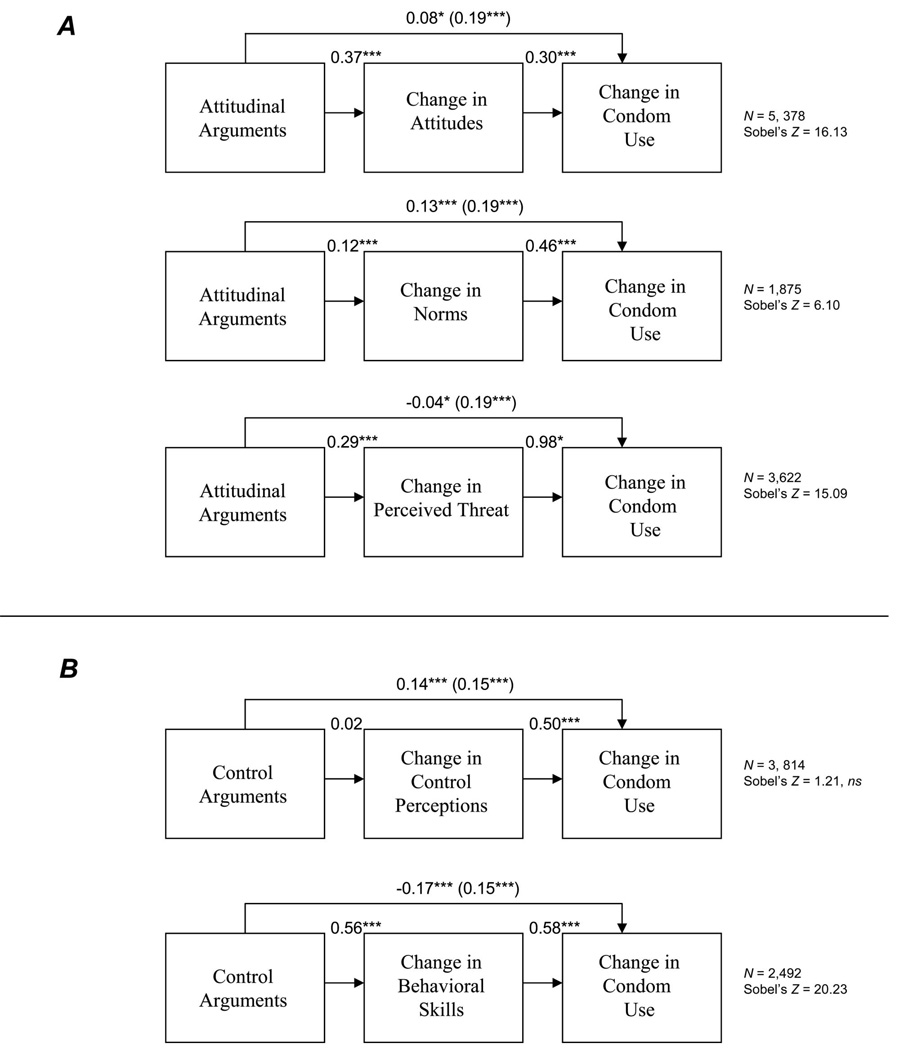
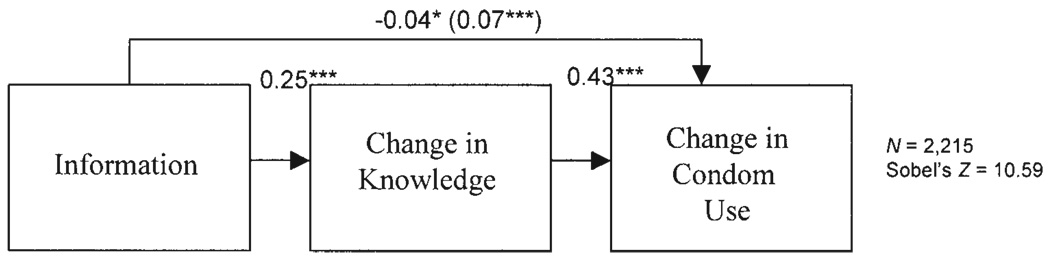
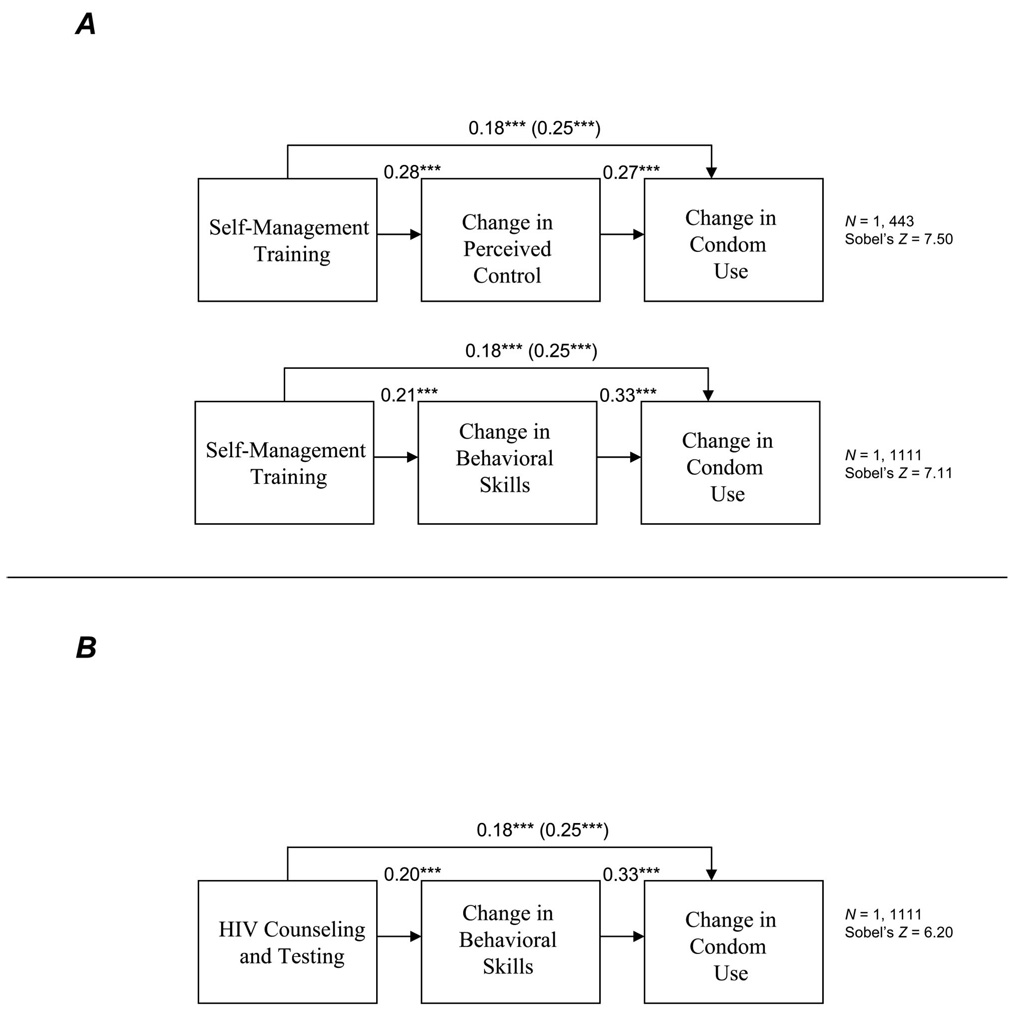
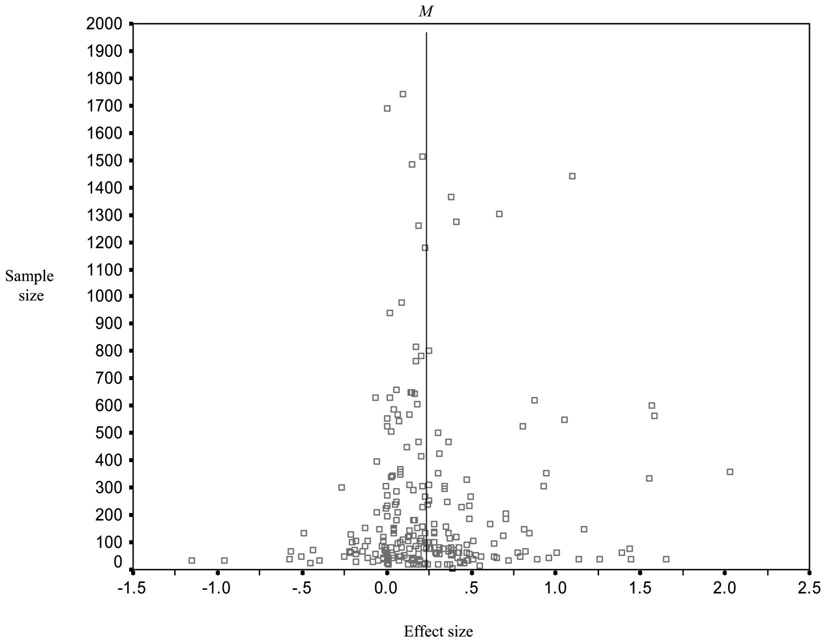
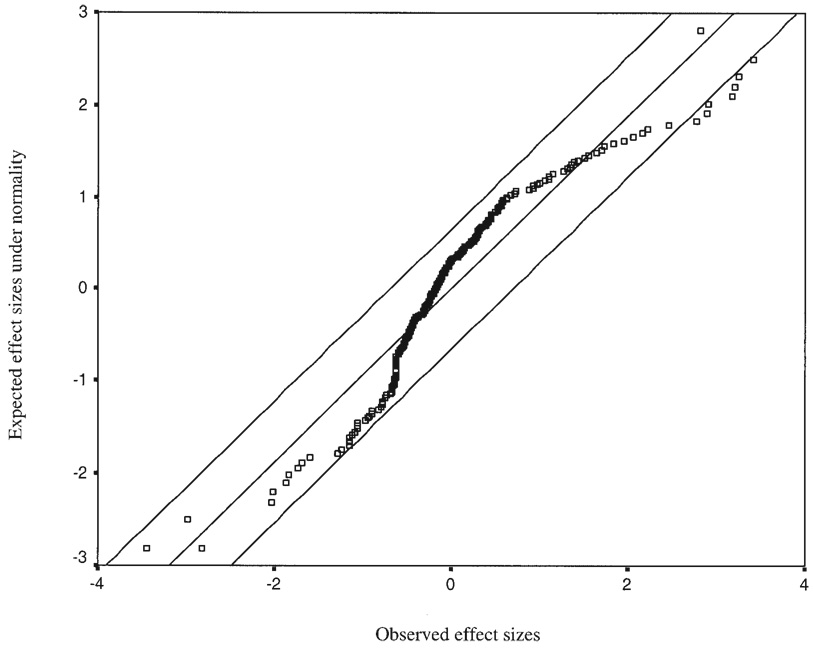
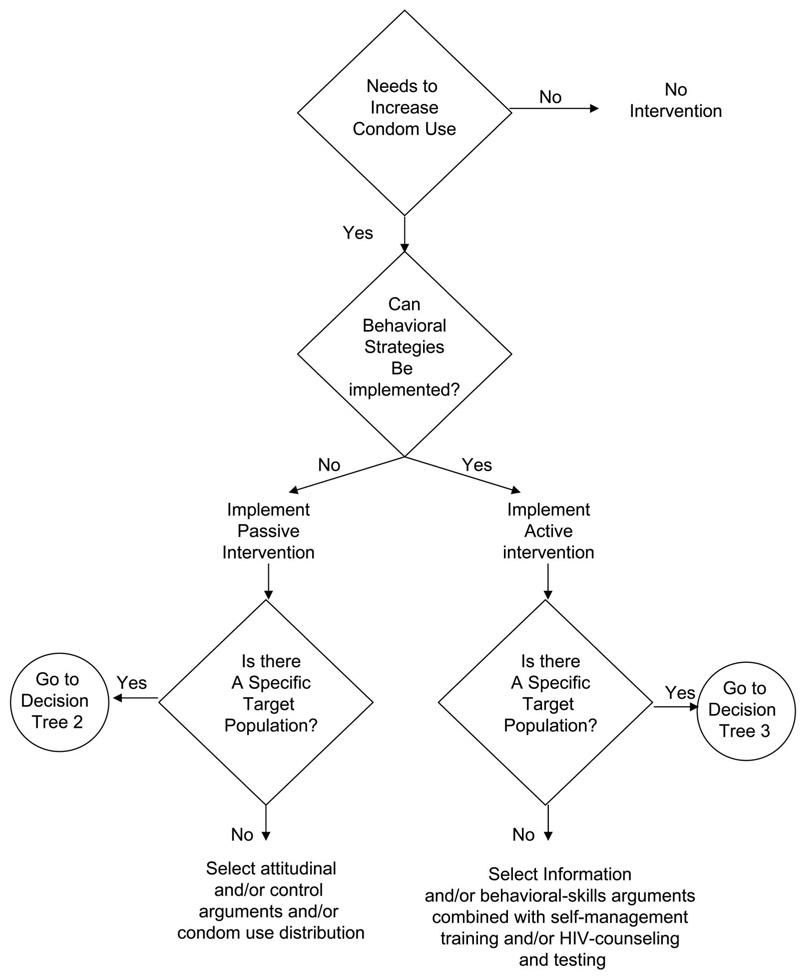
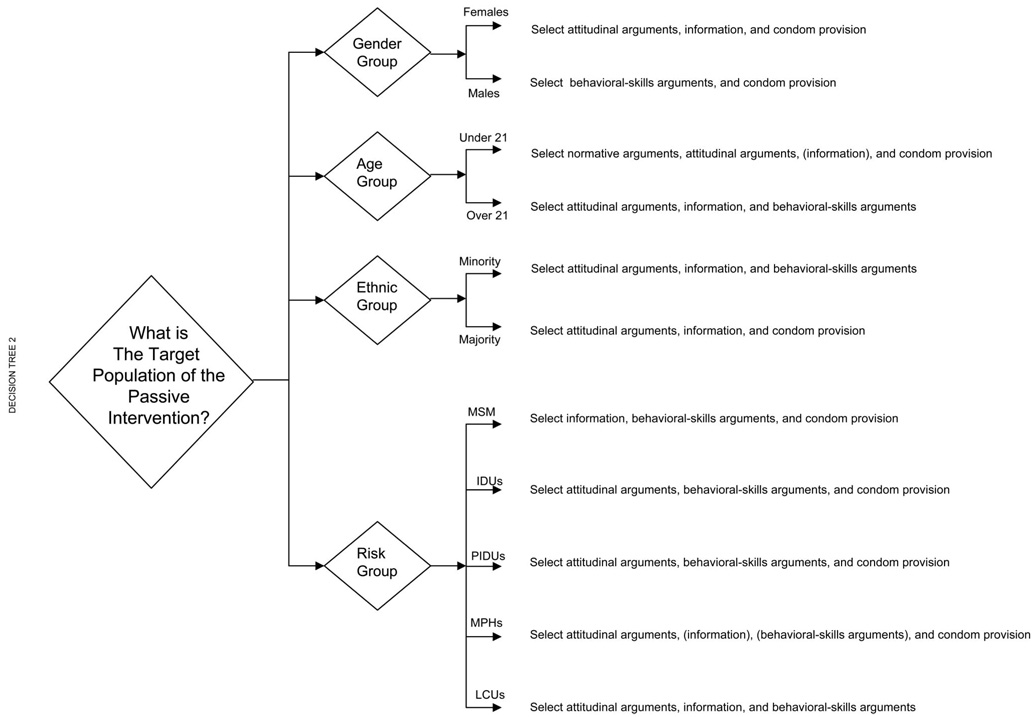
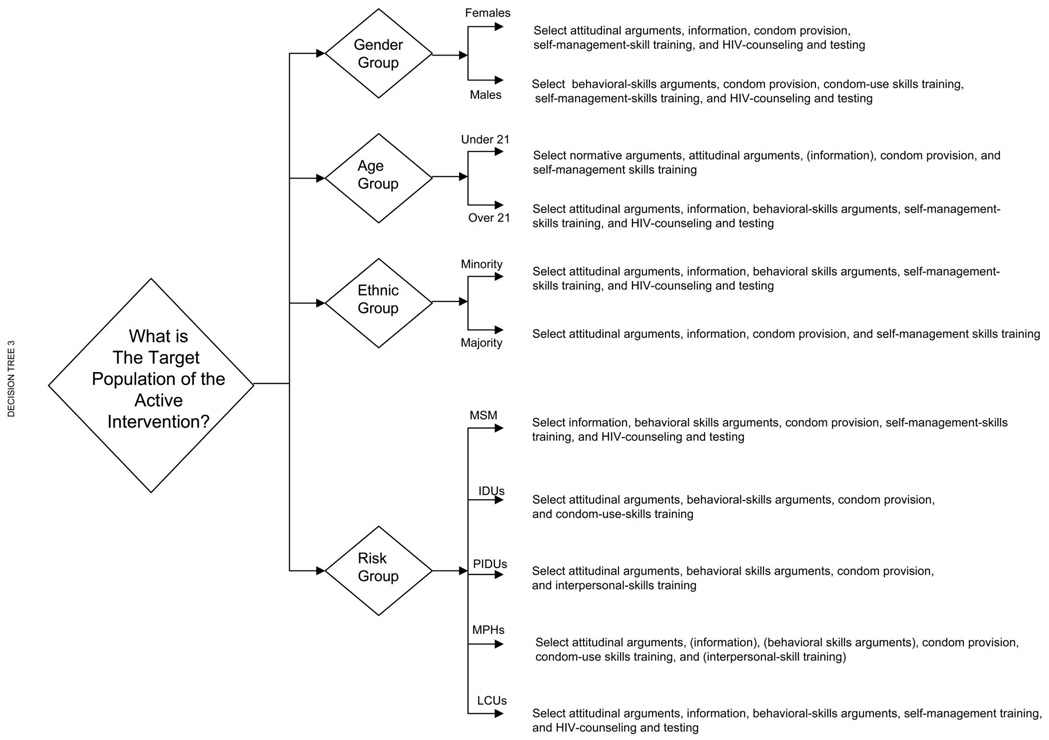
This meta-analysis tested the major theoretical assumptions about behavior change by examining the outcomes and mediating mechanisms of different preventive strategies in a sample of 354 HIV-prevention interventions and 99 control groups, spanning the past 17 years. There were 2 main conclusions from this extensive review. First, the most effective interventions were those that contained attitudinal arguments, educational information, behavioral skills arguments, and behavioral skills training, whereas the least effective ones were those that attempted to induce fear of HIV. Second, the impact of the interventions and the different strategies behind them was contingent on the gender, age, ethnicity, risk group, and past condom use of the target audience in ways that illuminate the direction of future preventive efforts.


Figures

Figure 1
Figure 1
Behavior change for active interventions, passive interventions, and control groups. Weighted mean change as a function of condition (passive intervention, active intervention, or control group). A: Fixed-effects models. B: Random-effects models.
Figure 2
Figure 2
Path analyses to determine the mediating effects of change in specific psychological variables on changes in condom use among passive interventions. A: Effects of attitudinal arguments. B: Effects of behavioral skills arguments. Both models also included all the strategies used in passive interventions (see Table 3). However, for simplicity, the other paths are not presented. Path coefficients are standardized. The direct path when the mediator was not included appears in parentheses. Sobel tests were significant unless indicated as ns. *p < .05. ***p < .001.
Figure 3
Figure 3
Path analyses to determine the mediating effects of change in specific psychological variables on changes in condom use as a function of information among active interventions. This model also included all the strategies used in active interventions (see Table 4). However, for simplicity, the other paths are not presented. Path coefficients are standardized. The direct path when the mediator was not included appears in parentheses. The Sobel test was significant. *p < .05. ***p < .001.
Figure 4
Figure 4
Path analyses to determine the mediating effects of change in specific psychological variables on changes in condom use as a function of active strategies among active interventions. A: Effects of self-management behavioral skills training. B: Effects of HIV counseling and testing. All models also included all the strategies used in active interventions (see Table 4). However, for simplicity, the other paths are not presented. Path coefficients are standardized. The direct path when the mediator was not included appears in parentheses. Sobel tests were significant. ***p < .001.
Figure 5
Figure 5
Funnel plot. Two effects with extremely large sample sizes were excluded to make the shape of the plot more apparent. These large sample groups had average effect sizes.
Figure 6
Figure 6
Normal quantile plot. The line on the diagonal indicates normality; the lines around the diagonal represent the 95% confidence interval around the normality line.
Figure 7
Figure 7
Decision tree 1 (initial decisions).
Figure 8
Figure 8
Decision tree 2 (passive interventions). MSM = men who have sex with men; IDUs = intravenous drug users; PIDUs = partners of intravenous drug users; MPHs = multiple-partner heterosexuals; LCUs = low condom users.
Figure 9
Figure 9
Decision tree 3 (active interventions). MSM = men who have sex with men; IDUs = intravenous drug users; PIDUs = partners of intravenous drug users; MPHs = multiple-partner heterosexuals; LCUs = low condom users.

Similar articles

Cited by

References

    1. Ajzen I. From intentions to actions: A theory of planned behavior. In: Kuhi J, Beckmann J, editors. Action-control: From cognition to behavior. Heildelberg, Germany: Springer; 1985. pp. 11–39.
    1. Ajzen I. The theory of planned behavior. Organizational Behavior and Human Decision Processes. 1991;50:179–211.
    1. Ajzen I. Perceived behavioral control, self-efficacy, locus of control, and the theory of planned behavior. Journal of Applied Social Psychology. 2002;32:665–683.
    1. Ajzen I, Fishbein M. Understanding attitudes and predicting social behavior. Englewood Cliffs, NJ: Prentice Hall; 1980.
    1. Ajzen I, Madden TJ. Prediction of goal-directed behavior: Attitudes, intentions, and perceived behavioral control. Journal of Experimental Social Psychology. 1986;22:453–474.

Publication types