

A microarray data-based semi-kinetic method for predicting quantitative dynamics of genetic networks
- PMID: 16351711
- PMCID: PMC1326213
- DOI: 10.1186/1471-2105-6-299
A microarray data-based semi-kinetic method for predicting quantitative dynamics of genetic networks
Abstract
Background: Elucidating the dynamic behaviour of genetic regulatory networks is one of the most significant challenges in systems biology. However, conventional quantitative predictions have been limited to small networks because publicly available transcriptome data has not been extensively applied to dynamic simulation.
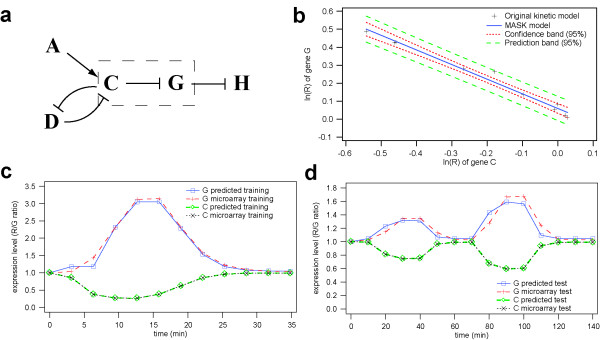
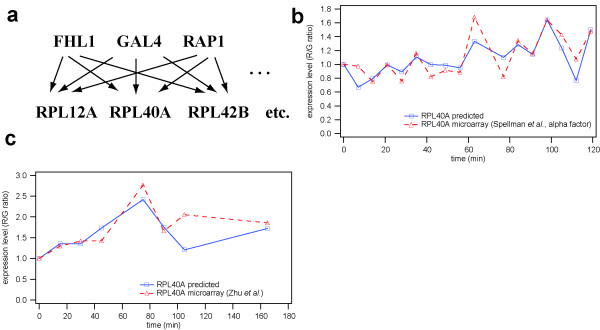
Results: We present a microarray data-based semi-kinetic (MASK) method which facilitates the prediction of regulatory dynamics of genetic networks composed of recurrently appearing network motifs with reasonable accuracy. The MASK method allows the determination of model parameters representing the contribution of regulators to transcription rate from time-series microarray data. Using a virtual regulatory network and a Saccharomyces cerevisiae ribosomal protein gene module, we confirmed that a MASK model can predict expression profiles for various conditions as accurately as a conventional kinetic model.
Conclusion: We have demonstrated the MASK method for the construction of dynamic simulation models of genetic networks from time-series microarray data, initial mRNA copy number and first-order degradation constants of mRNA. The quantitative accuracy of the MASK models has been confirmed, and the results indicated that this method enables the prediction of quantitative dynamics in genetic networks composed of commonly used network motifs, which cover considerable fraction of the whole network.
Figures


Similar articles
-
Phenotype analysis using network motifs derived from changes in regulatory network dynamics.Proteins. 2005 Aug 15;60(3):525-46. doi: 10.1002/prot.20538. Proteins. 2005. PMID: 15971229
-
Correlation and prediction of gene expression level from amino acid and dipeptide composition of its protein.BMC Bioinformatics. 2005 Mar 17;6:59. doi: 10.1186/1471-2105-6-59. BMC Bioinformatics. 2005. PMID: 15773999 Free PMC article.
-
Dynamic Bayesian network and nonparametric regression for nonlinear modeling of gene networks from time series gene expression data.Biosystems. 2004 Jul;75(1-3):57-65. doi: 10.1016/j.biosystems.2004.03.004. Biosystems. 2004. PMID: 15245804
-
Exploring genetic regulatory networks in metazoan development: methods and models.Physiol Genomics. 2002 Sep 3;10(3):131-43. doi: 10.1152/physiolgenomics.00072.2002. Physiol Genomics. 2002. PMID: 12209016 Review.
-
Chemical biology on PINs and NeeDLes.Curr Opin Chem Biol. 2005 Feb;9(1):31-7. doi: 10.1016/j.cbpa.2004.12.009. Curr Opin Chem Biol. 2005. PMID: 15701450 Review.
Cited by
-
Comparison of the contributions of the nuclear and cytoplasmic compartments to global gene expression in human cells.BMC Genomics. 2007 Sep 25;8:340. doi: 10.1186/1471-2164-8-340. BMC Genomics. 2007. PMID: 17894886 Free PMC article.
-
An Arabidopsis gene network based on the graphical Gaussian model.Genome Res. 2007 Nov;17(11):1614-25. doi: 10.1101/gr.6911207. Epub 2007 Oct 5. Genome Res. 2007. PMID: 17921353 Free PMC article.
-
Identification of transcription factor's targets using tissue-specific transcriptomic data in Arabidopsis thaliana.BMC Syst Biol. 2010 Sep 13;4 Suppl 2(Suppl 2):S2. doi: 10.1186/1752-0509-4-S2-S2. BMC Syst Biol. 2010. PMID: 20840729 Free PMC article.
-
Analysis of time-series gene expression data: methods, challenges, and opportunities.Annu Rev Biomed Eng. 2007;9:205-28. doi: 10.1146/annurev.bioeng.9.060906.151904. Annu Rev Biomed Eng. 2007. PMID: 17341157 Free PMC article.
-
Genome-wide analysis of mRNA decay rates and their determinants in Arabidopsis thaliana.Plant Cell. 2007 Nov;19(11):3418-36. doi: 10.1105/tpc.107.055046. Epub 2007 Nov 16. Plant Cell. 2007. PMID: 18024567 Free PMC article.
References
-
- Fleischmann RD, Adams MD, White O, Clayton RA, Kirkness EF, Kerlavage AR, Bult CJ, Tomb JF, Dougherty BA, Merrick JM. Whole-genome random sequencing and assembly of Haemophilus influenzae Rd. Science. 1995;269:496–512. - PubMed
-
- Lee TI, Rinaldi NJ, Robert F, Odom DT, Bar-Joseph Z, Gerber GK, Hannett NM, Harbison CT, Thompson CM, Simon I, Zeitlinger J, Jennings EG, Murray HL, Gordon DB, Ren B, Wyrick JJ, Tagne JB, Volkert TL, Fraenkel E, Gifford DK, Young RA. Transcriptional regulatory networks in Saccharomyces cerevisiae. Science. 2002;298:799–804. doi: 10.1126/science.1075090. - DOI - PubMed
Publication types
MeSH terms
LinkOut - more resources
Full Text Sources
Other Literature Sources
Molecular Biology Databases
