. 2005 Dec 20;102(51):18664-9.
doi: 10.1073/pnas.0509153102. Epub 2005 Dec 13.

Augmenting neurotransmitter release by enhancing the apparent Ca2+ affinity of synaptotagmin 1

Affiliations

Augmenting neurotransmitter release by enhancing the apparent Ca2+ affinity of synaptotagmin 1

J-S Rhee et al. Proc Natl Acad Sci U S A. .

Abstract

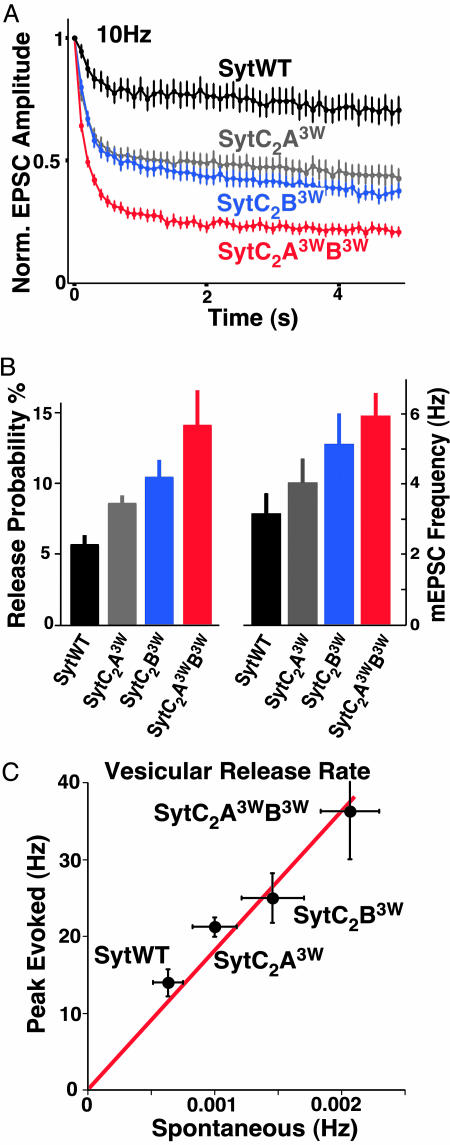
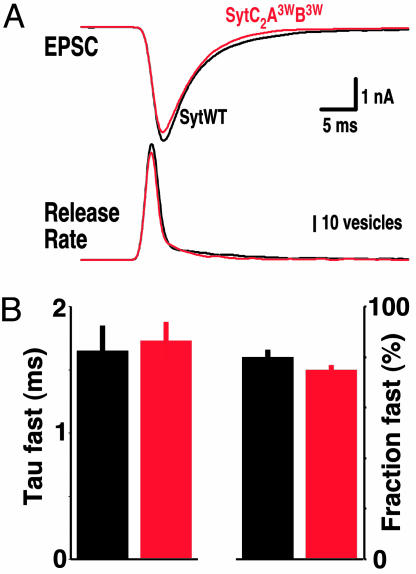
Synaptotagmin 1 likely acts as a Ca2+ sensor in neurotransmitter release by Ca2+-binding to its two C2 domains. This notion was strongly supported by the observation that a mutation in the C2A domain causes parallel decreases in the apparent Ca2+ affinity of synaptotagmin 1 and in the Ca2+ sensitivity of release. However, this study was based on a single loss-of-function mutation. We now show that tryptophan substitutions in the synaptotagmin 1 C2 domains act as gain-of-function mutations to increase the apparent Ca2+ affinity of synaptotagmin 1. The same substitutions, when introduced into synaptotagmin 1 expressed in neurons, enhance the Ca2+ sensitivity of release. Mutations in the two C2 domains lead to comparable and additive effects in release. Our results thus show that the apparent Ca2+ sensitivity of release is dictated by the apparent Ca2+ affinity of synaptotagmin 1 in both directions, and that Ca2+ binding to both C2 domains contributes to Ca2+ triggering of release.


Figures

Fig. 1.
Fig. 1.
Models of the C2A domain (Upper) and C2B domain (Lower) of synaptotagmin 1 before (Left) and after (Right) mutating exposed hydrophobic residues of the Ca2+-binding loops to tryptophans. The mutated residues and the tryptophans are shown as orange space-filling models, and the Ca2+ ions are represented by cyan spheres. The models illustrate the increase in exposed hydrophobic surface area and the drastic change in shape that results from the mutations.
Fig. 2.
Fig. 2.
Ca2+-dependent phospholipid binding properties of SytWT, SytC2A3W, SytC2B3W, and SytC2A3WC2B3W. Wild-type or mutant forms of GST-synaptotagmin 1 C2AB domains were incubated with liposomes (41% phosphatidylcholine, 32% phosphatidylethanolamine, 10% phosphatidylserine, 5% phosphatidylinositol, 10% cholesterol) containing no PIP and PIP2 (Upper), or 0.25% PIP + 0.05% PIP2 (Lower) in the presence of free Ca2+ at the concentrations shown, clamped by Ca2+/Mg2+/EGTA buffers. Liposomes were centrifuged and washed, and bound proteins were analyzed by SDS/PAGE and Coomassie blue staining. Data shown are representative of experiments performed multiple times.
Fig. 3.
Fig. 3.
Enhanced apparent Ca2+ sensitivity of glutamate release in hippocampal synapses expressing SytC23W mutants. (A) Exemplary evoked synaptic currents from hippocampal Syt-/- neurons rescued by overexpression of SytWT (black), SytC2A3WB3W mutant (red), and negative control mutant SytC2A3DAC2B3DA (gray), which contains 6 C2A/B top loop aspartate-to-alanine substitutions that eliminate Ca2+-dependent phospholipid binding and rescue activity (28). (Inset) Bar plot shows mean EPSC amplitudes of SytWT (black), SytC2A3W (gray), SytC2B3W (blue), and SytC2A3WB3W (red) rescues. Number of cells is indicated within each bar. (B) Exemplary EPSCs from SytWT rescues (Left) and SytC2A3WB3W rescues (Right) at 0.5 mM (gray trace), 4 mM (black), and 8 mM (red) external Ca2+. (C) Mean apparent Ca2+ sensitivity of EPSC amplitudes in SytWT and the three SytC23W rescues. EPSC amplitudes measured at 0.2-12 mM external Ca2+ (with 1 mM Mg2+ held constant) were normalized to the response evoked at the highest Ca2+ concentration, and the data were fitted with a Hill function. SytC2A3WB3W, n = 12; SytWT, n = 18; SytC2A3W, n = 10; and SytC2B3W, n = 12.
Fig. 4.
Fig. 4.
Increased vesicular release probability in the gain-of-function synaptotagmin 1 mutants. (A) Plot of mean normalized EPSC amplitudes of SytWT and all three SytC23W mutants rescues during a high stimulation 10-Hz action potential train (5-s duration). (B) Bar plot of the vesicular release probability (Left) and miniature EPSC (mEPSC) frequency (Right). (C) Correlation of vesicular release rates during spontaneous release and at the peak of the evoked response in SytWT and SytC2A3W, SytC2B3W, and SytC2A3WB3W mutant rescues. The linear fit corresponds to a constant increase in release rate by the Ca2+-triggering event by ≈18,200-fold.
Fig. 5.
Fig. 5.
Enhanced Ca2+ sensitivity of triggered neurotransmitter release does not affect the time course of neurotransmitter release. (A Upper) Exemplary EPSCs from SytWT (black trace) and SytC2A3WB3W rescues (red trace). (A Lower) Corresponding vesicle release rate after deconvolution of EPSC with mean mEPSC time course. (B) Bar plot of mean time course (Left) and relative amplitude of the fast component of release (Right). The time courses of the decay phase were individually fitted with two exponentials to reveal the fast and slow components of vesicular release. Color code as in A. The time course of the slow component of release was not significantly changed. (SytWT, n = 22; Syt6W, n = 26.)

References

    1. Chapman, E. R. (2002) Nat. Rev. Mol. Cell Biol. 3, 498-508. - PubMed
    1. Südhof, T. C. (2004) Annu. Rev. Neurosci. 27, 509-547. - PubMed
    1. Sutton, R. B., Davletov, B. A., Berghuis, A. M., Südhof, T. C. & Sprang, S. R. (1995) Cell 80, 929-938. - PubMed
    1. Fernandez, I., Arac, D., Ubach, J., Gerber, S. H., Shin, O. H., Gao, Y., Anderson, R. G., Südhof, T. C. & Rizo, J. (2001) Neuron 32, 1057-1069. - PubMed
    1. Shao, X., Davletov, B. A., Sutton, R. B., Südhof, T. C. & Rizo, J. (1996) Science 273, 248-251. - PubMed

Publication types