

Heterotrimeric G proteins precouple with G protein-coupled receptors in living cells
- PMID: 16352729
- PMCID: PMC1317907
- DOI: 10.1073/pnas.0504778102
Heterotrimeric G proteins precouple with G protein-coupled receptors in living cells
Abstract
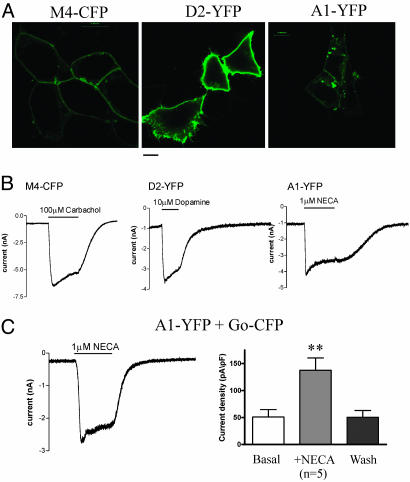
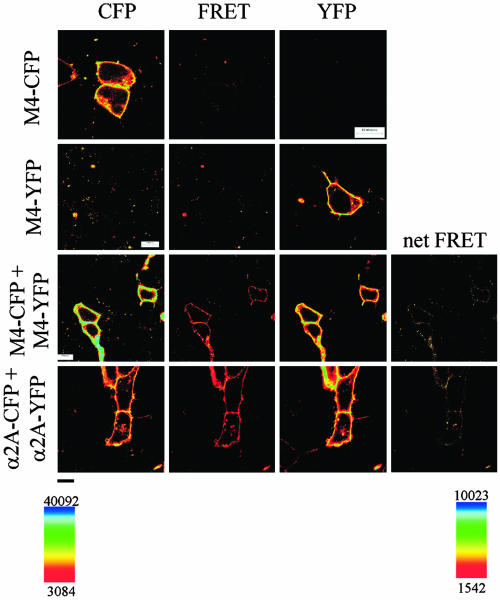
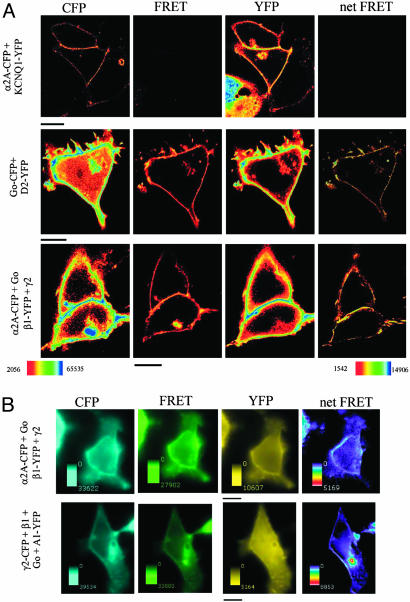
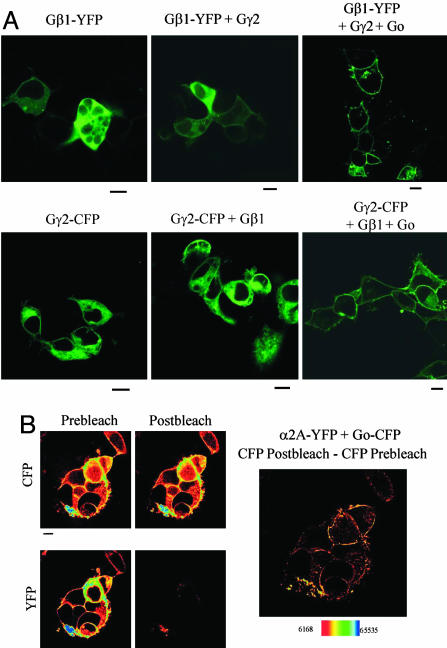
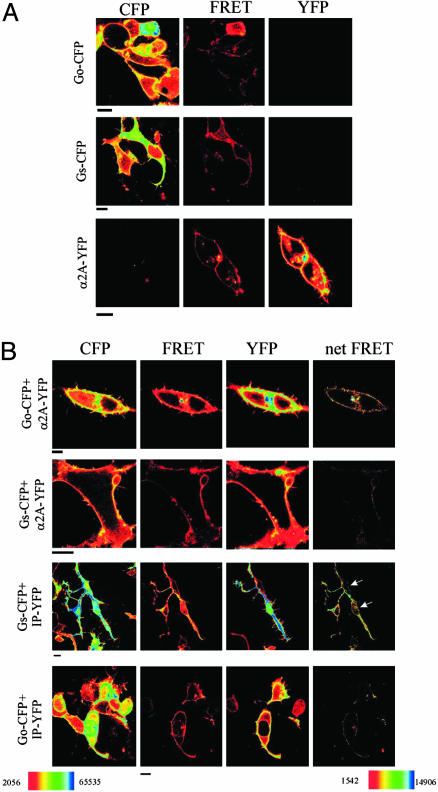
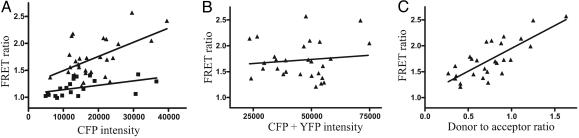
Using fluorescence resonance energy transfer (FRET) microscopy, we investigate how heterotrimeric G proteins interact with G protein-coupled receptors (GPCRs). In the absence of receptor activation, the alpha2A adrenergic and muscarinic M4 receptors are present on the cell membrane as dimers. Furthermore, there is an interaction between the G protein subunits alpha o, beta1, and gamma2 and a number of GPCRs including M4, alpha2A, the adenosine A1 receptor, and the dopamine D2 receptor under resting conditions. The interaction between GPCRs and Galpha proteins shows specificity: there is interaction between the alpha2A receptor and Go, but little interaction between the alpha2A receptor and Gs. In contrast, the predominantly Gs-coupled prostacyclin receptor interacted with Gs, but there was little interaction between the prostacyclin receptor and Go. Inverse agonists did not change the FRET ratio, whereas the addition of agonist resulted in a modest fall. Our work suggests that GPCR dimers and the G protein heterotrimer are present at the cell membrane in the resting state in a pentameric complex.
Figures
Similar articles
-
Interactions of the α-subunits of heterotrimeric G-proteins with GPCRs, effectors and RGS proteins: a critical review and analysis of interacting surfaces, conformational shifts, structural diversity and electrostatic potentials.J Struct Biol. 2013 Jun;182(3):209-18. doi: 10.1016/j.jsb.2013.03.004. Epub 2013 Mar 21. J Struct Biol. 2013. PMID: 23523730
-
Kinetic analysis of G protein-coupled receptor signaling using fluorescence resonance energy transfer in living cells.Adv Protein Chem. 2007;74:167-88. doi: 10.1016/S0065-3233(07)74005-6. Adv Protein Chem. 2007. PMID: 17854658 Review.
-
PtdIns(4,5)P2 stabilizes active states of GPCRs and enhances selectivity of G-protein coupling.Nature. 2018 Jul;559(7714):423-427. doi: 10.1038/s41586-018-0325-6. Epub 2018 Jul 11. Nature. 2018. PMID: 29995853 Free PMC article.
-
Gγ and Gα Identity Dictate a G-Protein Heterotrimer Plasma Membrane Targeting.Cells. 2019 Oct 13;8(10):1246. doi: 10.3390/cells8101246. Cells. 2019. PMID: 31614907 Free PMC article.
-
Monitoring the formation of dynamic G-protein-coupled receptor-protein complexes in living cells.Biochem J. 2005 Feb 1;385(Pt 3):625-37. doi: 10.1042/BJ20041361. Biochem J. 2005. PMID: 15504107 Free PMC article. Review.
Cited by
-
Gi/o-Protein Coupled Receptors in the Aging Brain.Front Aging Neurosci. 2019 Apr 24;11:89. doi: 10.3389/fnagi.2019.00089. eCollection 2019. Front Aging Neurosci. 2019. PMID: 31105551 Free PMC article. Review.
-
The microRNA-204-5p inhibits APJ signalling and confers resistance to cardiac hypertrophy and dysfunction.Clin Transl Med. 2022 Jan;12(1):e693. doi: 10.1002/ctm2.693. Clin Transl Med. 2022. PMID: 35060347 Free PMC article.
-
Compartmentalization of the GABAB receptor signaling complex is required for presynaptic inhibition at hippocampal synapses.J Neurosci. 2011 Aug 31;31(35):12523-32. doi: 10.1523/JNEUROSCI.1527-11.2011. J Neurosci. 2011. PMID: 21880914 Free PMC article.
-
Modulation of M4 muscarinic acetylcholine receptors by interacting proteins.Neurosci Bull. 2010 Dec;26(6):469-73. doi: 10.1007/s12264-010-0933-0. Neurosci Bull. 2010. PMID: 21113197 Free PMC article. Review.
-
G Protein Selectivity in Dopamine Receptors is Determined before GDP Release.Biochemistry. 2025 Jun 3;64(11):2439-2454. doi: 10.1021/acs.biochem.4c00779. Epub 2025 May 13. Biochemistry. 2025. PMID: 40358213 Free PMC article.
References
-
- Tolkovsky, A. M. & Levitzki, A. (1978) Biochemistry 17, 3795. - PubMed
-
- Gilman, A. G. (1987) Annu. Rev. Biochem. 56, 615-649. - PubMed
-
- Hille, B. (1992) Neuron 9, 187-195. - PubMed
-
- Tsunoda, S., Sierralta, J., Sun, Y., Bodner, R., Suzuki, E., Becker, A., Socolich, M. & Zuker, C. S. (1997) Nature 388, 243-249. - PubMed
-
- Noma, A. & Trautwein, W. (1978) Pflügers Arch. 377, 193-200. - PubMed
Publication types
MeSH terms
Substances
Grants and funding
LinkOut - more resources
Full Text Sources
Other Literature Sources
Molecular Biology Databases
