. 2006 Apr 1;107(7):2643-52.
doi: 10.1182/blood-2005-09-3904. Epub 2005 Dec 13.

Differentiation of naive cord-blood T cells into CD19-specific cytolytic effectors for posttransplantation adoptive immunotherapy

Affiliations

Differentiation of naive cord-blood T cells into CD19-specific cytolytic effectors for posttransplantation adoptive immunotherapy

Lisa Marie Serrano et al. Blood. .

Abstract

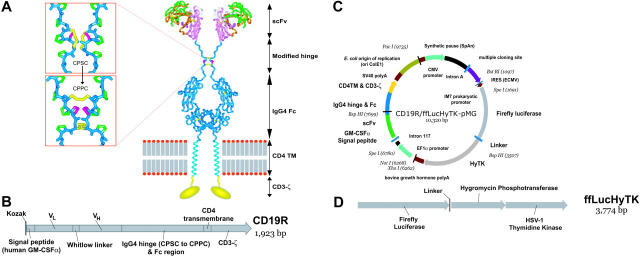
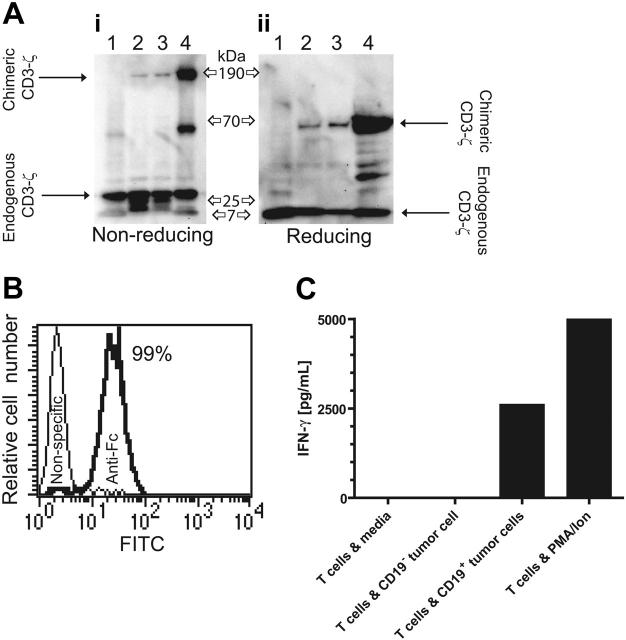
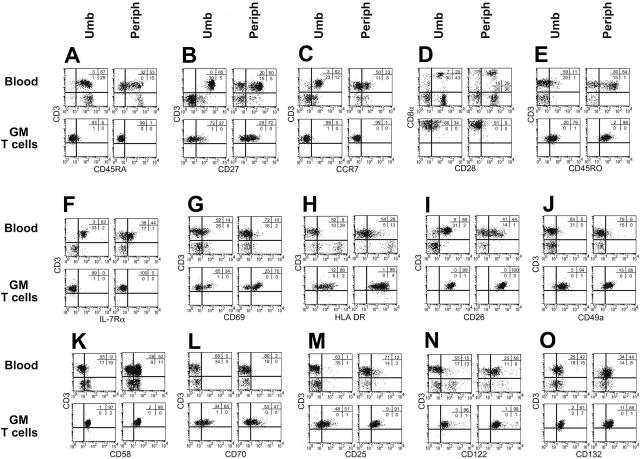
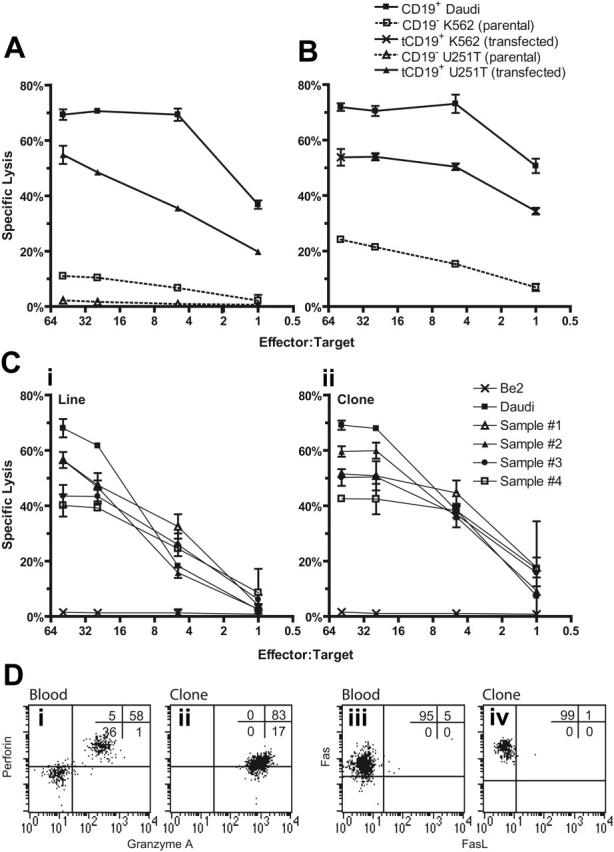
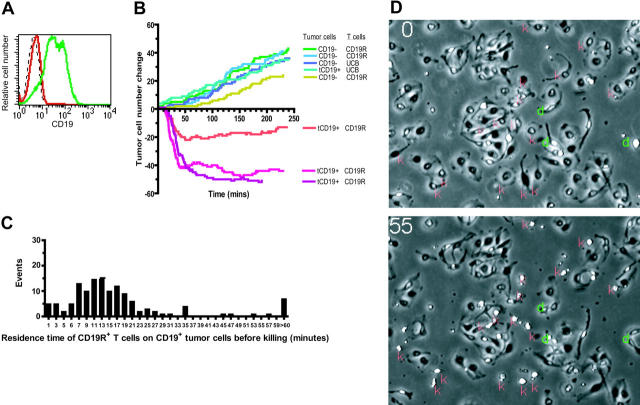
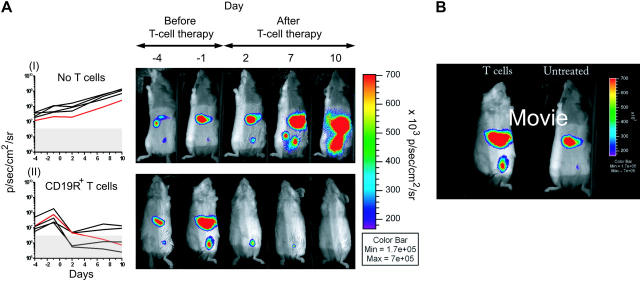
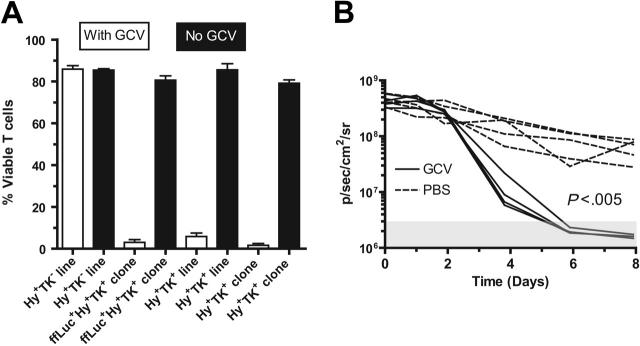
Disease relapse is a barrier to achieving therapeutic success after unrelated umbilical cord-blood transplantation (UCBT) for B-lineage acute lymphoblastic leukemia (B-ALL). While adoptive transfer of donor-derived tumor-specific T cells is a conceptually attractive approach to eliminating residual disease after allogeneic hematopoietic stem cell transplantation, adoptive immunotherapy after UCBT is constrained by the difficulty of generating antigen-specific T cells from functionally naive umbilical cord-blood (UCB)-derived T cells. Therefore, to generate T cells that recognize B-ALL, we have developed a chimeric immunoreceptor to redirect the specificity of T cells for CD19, a B-lineage antigen, and expressed this transgene in UCB-derived T cells. An ex vivo process, which is compliant with current good manufacturing practice for T-cell trials, has been developed to genetically modify and numerically expand UCB-derived T cells into CD19-specific effector cells. These are capable of CD19-restricted cytokine production and cytolysis in vitro, as well as mediating regression of CD19+ tumor and being selectively eliminated in vivo. Moreover, time-lapse microscopy of the genetically modified T-cell clones revealed an ability to lyse CD19+ tumor cells specifically and repetitively. These data provide the rationale for infusing UCB-derived CD19-specific T cells after UCBT to reduce the incidence of CD19+ B-ALL relapse.


Figures

Figure 1.
Figure 1.
Schematics of CD19-specific chimeric immunoreceptor and DNA plasmid coexpressing CD19R and trifunctional reporter gene. (A) Ribbon-model of the CD19-specific chimeric immunoreceptor (CD19R) shown dimerized on the cell surface. CD19R is composed of murine scFv (coupled using the Whitlow linker71), a modified serine → proline (CPSC changed to CPPC, single-letter amino acid code) human Fc region, human CD4 transmembrane (TM) region, and human CD3-ζ domain. Coloring: pink = VH; green = VL; orange = CDR loops; white = Whitlow linker (GSTSGSGKPGSGEGSTKG); dark blue = hinge/Fc; light blue = transmembrane helix; yellow = CD3-ζ chain (schematic); red/gray = lipid bilayer (schematic); yellow sticks = disulfides; magenta = second proline in CPPC sequence. Boxes show stick models of CPSC to CPPC amino acid change in the modified IgG4 hinge region. Computer modeling demonstrates that substitution of serine with proline at position 241 (Kabat numbering system) in the IgG4 hinge region creates a molecule predisposed to interchain disulfide bridging, whereas the native hinge is predisposed to intrachain disulfide bond formation. In the top panel the flexible serine in the sequence CPSC allows intrachain disulfides to form, thus preventing covalent bonding of heavy chain pairs. In the bottom panel the rigid proline in CPPC prevents the cysteines in the mutant IgG4 hinge from forming intrachain bonds, thus favoring covalent bonding of heavy chain pairs. Coloring: dark blue = backbone atoms; green = proline side chains; magenta = serine wild-type (top panel) or proline mutation (bottom panel); yellow = disulfide-bonded cysteines. (B) Schematic of fusion gene of CD19R showing component parts. (C) Schematic of DNA plasmid CD19R/ffLucHyTK-pMG to expresses CD19R gene under control of human elongation factor (EF) 1α promoter and ffLucHyTK gene under control of the human cytomegalovirus (CMV) major immediate early promoter. This plasmid is similar to the clinical vector CD19R/HyTK-pMG, with the exception in the clinical vector the IRES element was deleted, intron A was reduced, and a 20-base pair sequence was deleted 5′ to the IM7 prokaryotic promoter. Selected restriction enzyme sites are shown. (D) Schematic of fusion gene composed of firefly luciferase linked via amino acid (linker = QLISGANGV) to hygromycin phosphotransferase and thymidine kinase (predicted molecular weight of ∼137 kDa).
Figure 2.
Figure 2.
Expression of CD19-specific chimeric immunoreceptor in UCB-derived T cells leads to CD19-dependent cytokine production. (A) Western blot of lysates of lane 1 unmodified Jurkat cells, lanes 2 and 3 two UCB-derived T-cell clones genetically modified with the plasmids CD19R/ffLucHyTK-pMG and CD19R/HyTK-pMG, respectively, and lane 4 CD19R+ Jurkat cell under nonreducing (i) and reducing (ii) conditions and stained with mAb specific for CD3-ζ. (B) Flow cytometry staining of UCB-derived CD8+ genetically modified T-cell clone with goat-derived polyclonal FITC-conjugated Fc-specific antibody (bold line) and nonspecific control antibody. (C) CD19-specific activation of genetically modified UCB-derived T cells for IFN-γ cytokine production. As a positive control, UCB-derived T cells were stimulated in CM with PMA (10 ng/mL) and ionomycin (1 μM). Background cytokine production was determined from T cells incubated in CM. IFN-γ was measured by CBA after 12 hours of culture.
Figure 3.
Figure 3.
Cell-surface phenotype of UCB-derived and PB-derived T cells before and after genetic modification. Multiparameter flow cytometry was performed on mononuclear cells from peripheral (periph) and cord blood (Umb) and genetically modified (GM) T cells that had been propagated for an average of 10 weeks under cytocidal concentrations of hygromycin B. Isotype-matched fluorescent mAb was used to establish the negative gates. The percentage of cells in each quadrant is shown.
Figure 4.
Figure 4.
CD19-specific lysis of tumor targets by genetically modified UCB-derived T cells. (A) Killing of tumor CD19+ target cells (HLA Ineg Daudi and genetically modified U251T) by CD8+ CD19R+ T-cell clone in 4-hour CRA. Background lysis of CD19 (parental K562 and U251T) cells is shown. (B) Killing of HLA class I/II K562 cells transfected to express CD19 by CD8+ T-cell clone. (C) Killing of 4 primary B-ALL samples by UCB-derived genetically modified CD19-specific T-cell line (i) and T-cell clone (ii). (Flow cytometry on the B-ALL samples established that the lymphoid-gated cells were 68% to 83% CD19+CD10+ (versus 96% for Daudi cells) and 92% to 98% CD19+ (versus 100%), while the total population was 44% to 72% CD19+CD10+ (versus 91%) and 70% to 94% CD19+ (versus 99%). Background lysis of CD19BE2 neuroblastoma cells is shown. CRA results of mean ± SD specific lysis of triplicate wells at E/T cell ratios of 50:1 to 1:1 are shown. (D) Intracellular multiparameter flow cytometry evaluating intracellular perforin and granzyme A expression, gating on CD8α+ lymphocytes, and cell-surface expression of Fas and FasL, gating on CD3+ lymphocytes, obtained from cryopreserved unmanipulated UCB (i and iii) and genetically modified UCB-derived T-cell clone (ii and iv). Crosshairs were established using isotype-matched nonspecific control mAbs.
Figure 5.
Figure 5.
Video time-lapse microscopy to evaluate tumor-cell killing by UCB-derived T cells. (A) Relative binding of human CD19-specific mAb by flow cytometry expression of truncated CD19 on parental U251T (red) and transfected U251T (green), compared with isotype-matched mAb binding to transfected U251T (dashed black line). The CD19 expression of transfected cells was 87% as measured by Overton analysis (FCS Express Version 2; De Novo Software, Ontario, Canada). These tumor cells were used in the VTLM studies described for panel B. (B) Net change in number of adherent tumor cells over time (240 minutes, 960 frames) cocultured with UCB-derived T cells. Tumor-cell divisions were observed in all experimental conditions (CD19R± T cells cocultured with CD19± tumor cells). Killing of tumor cells, represented by a net decrement in the number of tumor cells (below the x-axis), was only observed in flasks of CD19R+ T cells cocultured with CD19+ tumor cells. The data were compiled from 3 video time-lapse sequences acquired with the combination of CD8+ CD19R+ T-cell clone and CD19+ tumor cells, and 5 video time-lapse sequences were acquired of negative controls (parental CD19 tumor cells and CD8+ UCB derived T-cell clone that did (CD19R+) and did not (CD19R) express the chimeric immunoreceptor). (C) Histogram of residence time (minutes) of CD8+ CD19-specific T-cell clone on CD19+ tumor cell before a CD19+ U251T tumor-killing event was recorded. Two-minute bins were used, and 145 T-cell contact events were evaluated. (D) VTLM of UCB-derived CD19R+ T cells cocultured with CD19+ tumor cells. Two images are shown (at 0 and 55 minutes). Red “k” indicates killing event, green “d” indicates cell division. Online material includes a movie (Video S1) of the VTLM (at 1 × and 2 × magnification) showing the coculture of CD19-specific T cells with CD19+ tumor cells over 120 minutes (part I) and first 60 minutes (part II).
Figure 6.
Figure 6.
Elimination of established CD19+ tumor by adoptive transfer of UCB-derived CD19R+ T cells. (A) Longitudinal monitoring of bioluminescence quantification of Daudi tumor-derived ffLuc-activity in 2 groups of NOD/Scid mice (5 mice per group) and ffLuc-derived bioluminescent signals are graphed over time. (I) Group that received no cellular therapy and (II) group that received cellular therapy with CD8+ CD19-specific T-cell clone. Background bioluminescence (as measured in parallel from mouse with no tumor, but which did receive d-luciferin) was calculated for each group at each imaging time point. The red lines correspond to the in vivo optical bioluminescence images of tumor from one mouse selected from each group. (Genetically modified Daudi in vitro ffLuc-activity was 55.1 ± 2.2 CPM/cell [mean ± SD] compared to 0.072 ± 0.017 CPM/cell [mean ± SD] for parental unmodified cells.) (B) Movie still (see Video S2) of time lapse BLI of ffLuc+ Daudi in 2 NOD/Scid mice starting the day before adoptive immunotherapy. One mouse received adoptive transfer of CD8+ CD19-specific UCB-derived T-cell clone (left), and one mouse received no cellular therapy. Color bar displays relative ffLuc activity in units of p/s/cm2/sr.
Figure 7.
Figure 7.
UCB-derived T cells genetically modified to express CD19R and TK genes are selectively eliminated by ganciclovir in vitro and in vivo. (A) UCB-derived T cells expressing TK gene can be eradicated by 5 μM GCV in vitro. The control Hy+TK UCB-derived T-cell line was genetically modified with the plasmid HyMP1-pEK. Initially, 4 × 10⁴ T cells plated/well in triplicate, and after 14 days the average viable cell count is presented as percentage of mean viable cells ± SD. (B) UCB-derived CD8+ CD19R+ffLucHyTK+ T cells can be ablated by GCV in vivo. T cells were stimulated in vivo with CD19+ tumor and exogenous rhIL-2 to promote T-cell persistence. Data are shown for 5 mice in each group (broken lines indicate mice that received PBS; solid lines, mice that received GCV). The background bioluminescence (mice that were injected with luciferin but which received no T cells) over the 12-day experiment for both the groups of mice receiving GCV or PBS was approximately 3 × 10⁶ ± 106 a p/s/cm2/sr (mean ± SD) as represented by the shaded box. Genetically modified T-cell in vitro ffLuc-enzyme activity was 1.6 ± 0.1 CPM/cell (mean ± SD), compared with 0.008 ± 0.004 CPM/cell (mean ± SD) background ffLuc-enzyme activity in ffLucneg T cells.

References

    1. Rubinstein P, Carrier C, Scaradavou A, et al. Outcomes among 562 recipients of placental-blood transplants from unrelated donors. N Engl J Med. 1998;339: 1565-1577. - PubMed
    1. Porter DL, June CH. T-cell reconstitution and expansion after hematopoietic stem cell transplantation:'T' it up! Bone Marrow Transplant. 2005;35: 935-942. - PubMed
    1. Warren EH, Gavin M, Greenberg PD, Riddell SR. Minor histocompatibility antigens as targets for T-cell therapy after bone marrow transplantation. Curr Opin Hematol. 1998;5: 429-433. - PubMed
    1. Nijmeijer BA, Willemze R, Falkenburg JH. An animal model for human cellular immunotherapy: specific eradication of human acute lymphoblastic leukemia by cytotoxic T lymphocytes in NOD/scid mice. Blood. 2002;100: 654-660. - PubMed
    1. Dudley ME, Wunderlich JR, Robbins PF, et al. Cancer regression and autoimmunity in patients after clonal repopulation with antitumor lymphocytes. Science. 2002;298: 850-854. - PMC - PubMed

Publication types

MeSH terms