Comparative Study
. 2005 Dec 14;25(50):11577-85.
doi: 10.1523/JNEUROSCI.3411-05.2005.

Few CaV1.3 channels regulate the exocytosis of a synaptic vesicle at the hair cell ribbon synapse

Affiliations
Comparative Study

Few CaV1.3 channels regulate the exocytosis of a synaptic vesicle at the hair cell ribbon synapse

Andreas Brandt et al. J Neurosci. .

Abstract

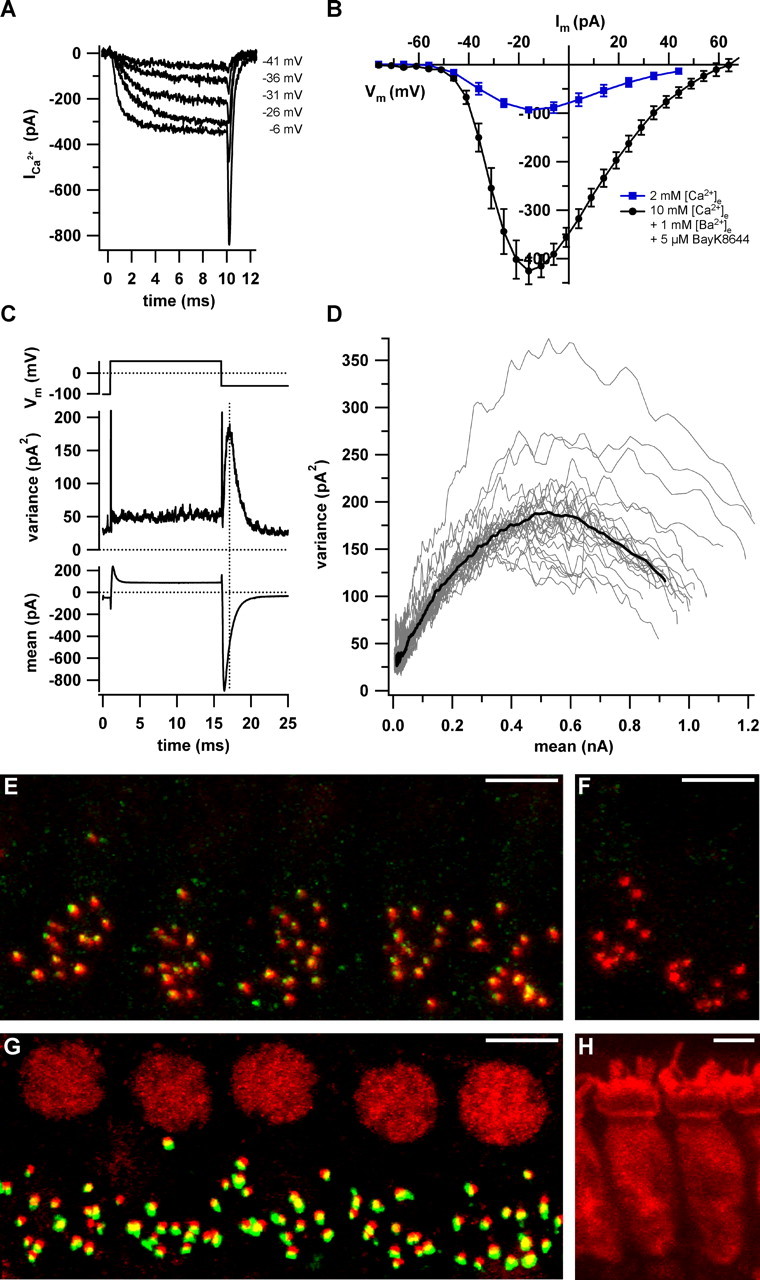
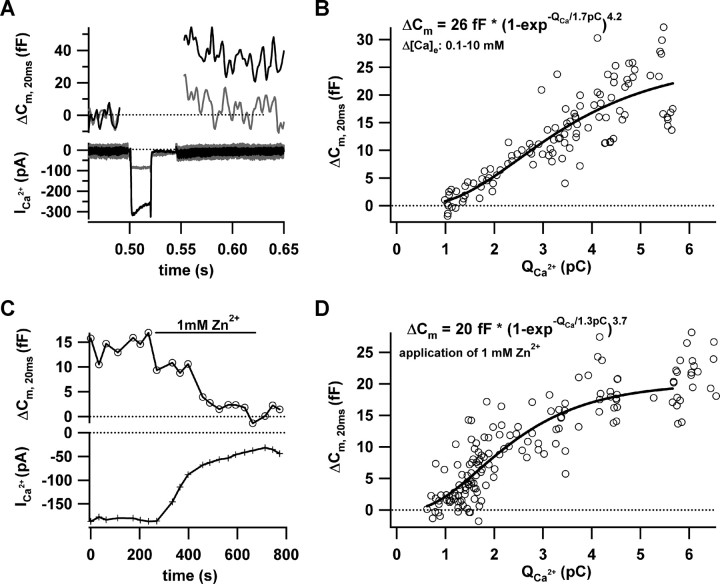
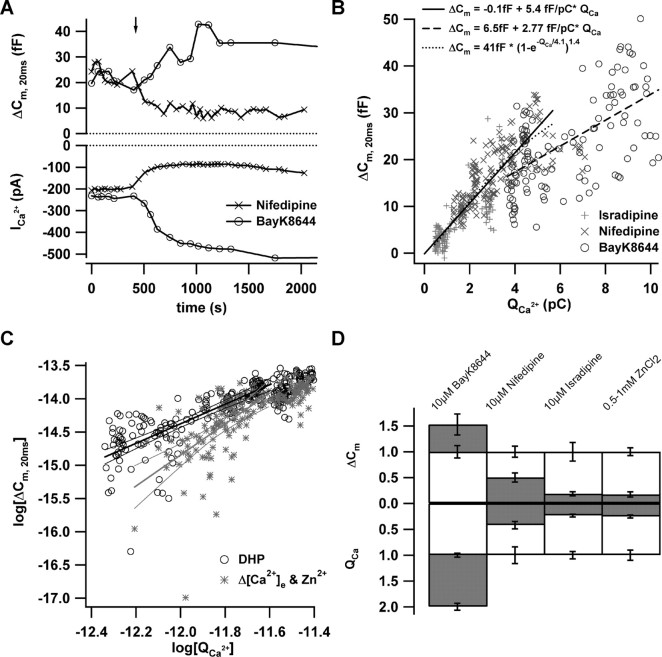
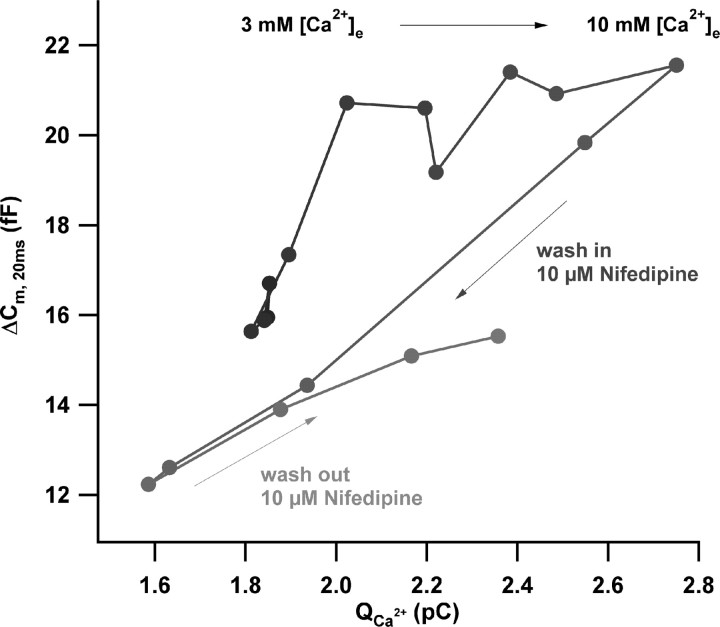
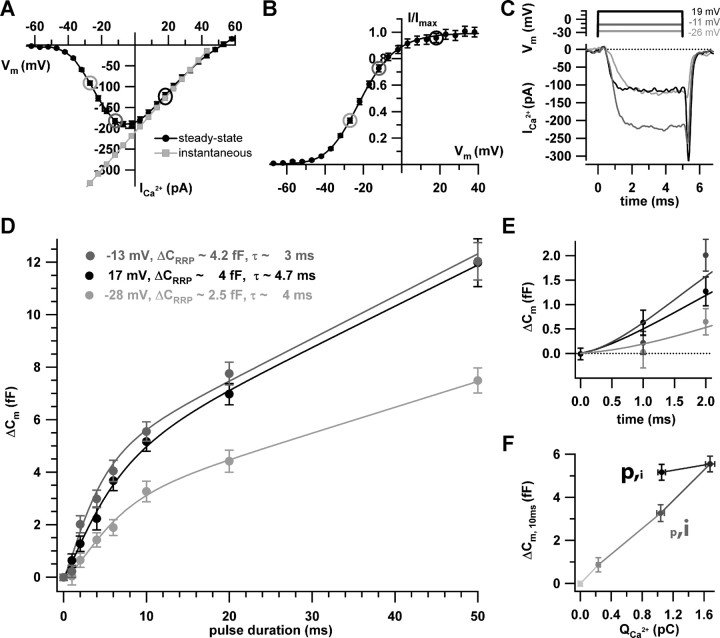
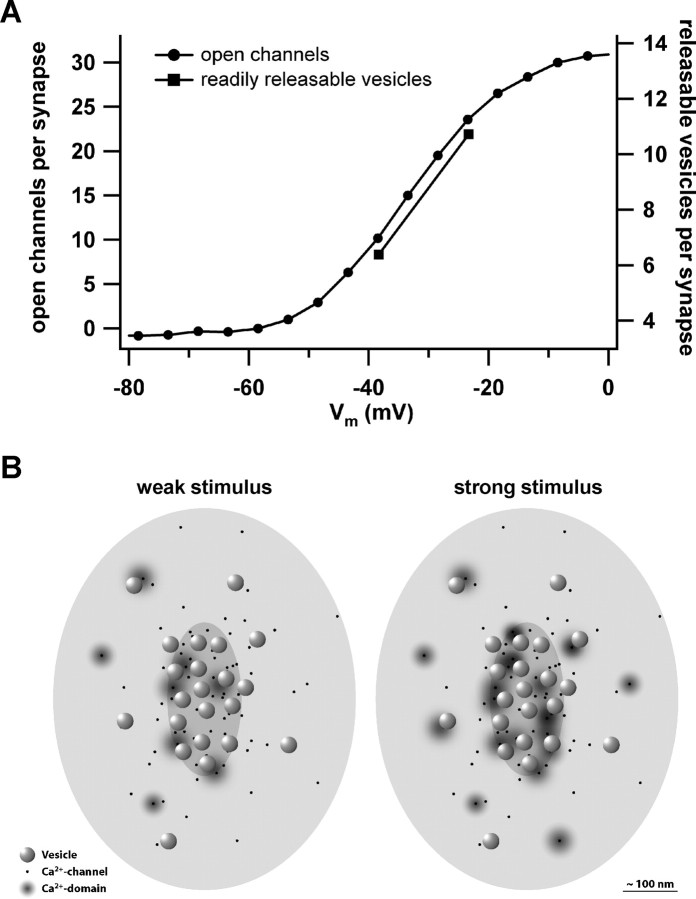
Hearing relies on faithful sound coding at hair cell ribbon synapses, which use Ca2+-triggered glutamate release to signal with submillisecond precision. Here, we investigated stimulus-secretion coupling at mammalian inner hair cell (IHC) synapses to explore the mechanisms underlying this high temporal fidelity. Using nonstationary fluctuation analysis on Ca2+ tail currents, we estimate that IHCs contain approximately 1700 Ca2+ channels, mainly of CaV1.3 type. We show by immunohistochemistry that the CaV1.3 Ca2+ channels are localized preferentially at the ribbon-type active zones of IHCs. We argue that each active zone holds approximately 80 Ca2+ channels, of which probably <10 open simultaneously during physiological stimulation. We then manipulated the Ca2+ current by primarily changing single-channel current or open-channel number. Effects on exocytosis of the readily releasable vesicle pool (RRP) were monitored by membrane capacitance recordings. Consistent with the high intrinsic Ca2+ cooperativity of exocytosis, RRP exocytosis changed nonlinearly with the Ca2+ current when varying the single-channel current. In contrast, the apparent Ca2+ cooperativity of RRP exocytosis was close to unity when primarily manipulating the number of open channels. Our findings suggest a Ca2+ channel-release site coupling in which few nearby CaV1.3 channels impose high nanodomain [Ca2+] on release sites in IHCs during physiological stimulation. We postulate that the IHC ribbon synapse uses this Ca2+ nanodomain control of exocytosis to signal with high temporal precision already at low sound intensities.


Figures

Figure 1.
Figure 1.
Counting Ca2+ channels and ribbon synapses in apical IHCs. A, Example Ca2+ currents evoked by 10 ms step depolarizations from –86 mV to the specified levels in the presence of 5μm BayK8644, 10 mm Ca2+, and 1 mm Ba2+. B, Average steady-state IV relationships in augmenting conditions (black circles; solutions as in A) and at close to physiological [Ca2+]e (2 mm; blue squares). C, Voltage-clamp protocol (top), variance (middle), and mean (bottom) calculated from a P/n-corrected ensemble of 500 sweeps (interval, 80 ms). D, Variance versus mean parabolas obtained from 27 ensembles of nine cells (gray traces) and the grand average calculated from parabolas of the individual cells (black trace). E, A typical 3D reconstruction of a wild-type organ of Corti after staining for CaV1.3 (green) and RIBEYE/CtBP2 (red). F, Identical processing of an organ of Corti from a CaV1.3 knock-out mouse. G, A typical double staining for RIBEYE/CtBP2 (red) and GluR2/3 glutamate receptors (green). Juxtaposed spots of red and green fluorescence represent intact ribbon synapses. IHCs were counted by means of their nuclear CtBP2 signal. H, The cytosolic staining using an antibody to calbindin (red). Scale bars, 5 μm.
Figure 2.
Figure 2.
Effects of changes in (apparent) single channel Ca2+ domain amplitude. A, Representative Ca2+ currents (bottom) and exocytic capacitance changes (ΔCm, 20 ms; top) in response to 20 ms depolarization to the peak Ca2+ current potential. The Ca2+ current was large and the ΔCm sizable in the presence of 10 mm [Ca2+]e, but the reduced Ca2+ current at 0.25 mm [Ca2+]e failed to elicit an obvious ΔCm. B, Scatter plot of ΔCm, 20 ms versus the corresponding Ca2+ current integrals (QCa) for three experiments in which [Ca2+]e was gradually changed (10, 4, 2, 1, 0.5, and 0.25 mm). The solid line is a least-squares fit of a power of exponent function to the data approximating the plateau of RRP exocytosis, the specific QCa, and the apparent cooperativity. C, The time course of ΔCm, 20 ms (top trace) and the Ca2+ current (bottom trace; 10 mm [Ca2+]e) for a typical perforated-patch experiment, in which Zn2+ (1 mm) was applied after a control steady state had been established. An obvious ΔCm, 20 ms drop occurred only after the Ca2+ current had already substantially declined. D, ΔCm, 20 ms and QCa of five such experiments (circles). The solid line presents a power of exponent fit (as in B).
Figure 3.
Figure 3.
Effects of primary changes in open Ca2+ channel number. A, The time course of exocytic ΔCm, 20 ms (top) and QCa (bottom) in response to repetitive depolarization (20 ms; to the peak Ca2+ current potential; 10 mm [Ca2+]e). In these representative perforated-patch experiments, nifedipine (10μm; ×) or BayK8644 (10μm; ○) were applied by slow bath perfusion as indicated by the arrow. B, ΔCm, 20 ms and QCa for a total of 15 such experiments (10μm isradipine, +; 10 μm nifedipine, ×; and 5 μm BayK8644, ○; n = 5 for each condition). DHP were washed in after achieving a control steady state as illustrated in A. The lines correspond to the fit functions provided in the graph. Solid and dotted lines, Line and power of exponent fits to the data acquired with inhibitory DHP (the fit interval from lowest integral up to 5 pC was chosen as in Fig. 2 for better comparison); dashed line, line fit to BayK8644 data. C, The logarithms of exocytic ΔCm, 20 ms (in farads) and QCa (in coulombs) for both manipulations (DHP, black circles; Zn2+ and Δ[Ca2+]e, gray asterisks). The lines represent line fits to both data sets (along with 99% confidence intervals) yielding Ca2+ cooperativities of 1.4 and 2.3 for DHP and Zn2+/Δ[Ca2+]e, respectively. D, Steady-state effects of 10 μm BayK8644, 10 μm nifedipine, 10 μm isradipine, or 0.5–1 mm Zn2+ (n = 5 for each condition) on ΔCm, 20 ms (top) and QCa (bottom). The gray filling indicates the average ΔCm, 20 ms and QCa estimates after drug application after normalization to the grand averages obtained before drug. Error bars represent SEM. QCa, Ca2+ current integrals.
Figure 4.
Figure 4.
Direct comparison of the effects of changes in single-channel current and open-channel number on RRP exocytosis. Scatter plot of ΔCm, 20 ms versus the corresponding Ca2+ current integrals of a representative perforated-patch experiment during (1) slow change of [Ca2+]e from 3 to 10 mm, (2) application of 10 μm nifedipine at 10 mm [Ca2+]e, and (3) wash out of nifedipine in the continued presence of 10 mm [Ca2+]e are shown. Data were smoothed by nonoverlapping two-point box car averaging. The time course of the experiment is indicated by the black-to-gray gradient.
Figure 5.
Figure 5.
Effects of depolarization strength on RRP exocytosis. A, B, The steady-state IV (black symbols) of the experiments used to study the voltage dependence of RRP exocytosis (10 mm [Ca2+]e). The circles indicate the potentials for which the kinetics of exocytosis was studied. The instantaneous IV (A; gray symbols) was approximated as the ratio of the steady-state IV (A; black symbols) and the channel activation curve (B) in the range of 5–50 mV and then linearly extrapolated toward hyperpolarized potentials. C, Example currents for depolarization to –26, –11, and 19 mV, using the color coding of A and B. D, Summary of the exocytic ΔCm achieved for the three depolarization levels and different pulse durations. Pulses were applied to 33 IHCs in random order with an interval of at least 30 s and 1073 sweeps were used for analysis. Of those, a smaller number of sweeps was acquired at –41 mV (n = 158; data not shown), which did not provide a sufficiently resolved kinetics plot. E, The first 2 ms of exocytosis kinetics in better resolution. F, The exocytic responses (ΔCm, 10 ms) to 10-ms-long depolarizations to four potentials (–41, –28, –13, and 17 mV) versus the corresponding Ca2+ current integrals. The first point corresponds to a 20 ms blank (–86 mV). The gray scale codes for depolarization strength as in the other panels: from light gray (–86 mV) to black (17 mV). Note the different amounts of exocytosis despite similar Ca2+ current integrals for –28 mV [larger single-channel current (see A) but lower open probability (see B)] and 17 mV [smaller i (see A) but larger p (see B)]. Error bars represent SEM.
Figure 6.
Figure 6.
Putative relationship of open Ca2+ channels and active release sites at the IHC synapses during depolarization. A, The putative Ca2+ channel activation at the average IHC ribbon synapse as function of depolarization (circles). The squares represent the numbers of readily releasable vesicles estimated at –28 and –13 mV [analysis of Fig. 5D; conversion factor 28 aF (Khimich et al., 2005)]. B, A diagram sketching the IHC active zone seen from hair cell cytosolic site with the ribbon removed. We pseudo-randomly scattered 80 Ca2+ channels (black dots) at the active zone with a higher density underneath the ribbon (medium gray ellipsoid) than for the rest of the active zone (postsynaptic density indicated as light gray ellipsoid). Synaptic vesicles (spheres) preferentially dock to the plasma membrane opposite to the postsynaptic density and were placed in a more regular array according to our electron microscopy findings (data not shown). Domains of elevated [Ca2+] are indicated by gray gradients. Whereas in the case of weak stimulation, only few channels open and drive exocytosis of their vesicles, overlap of Ca2+ domains is expected for saturating stimulation.

References

    1. Art JJ, Fettiplace R (1987) Variation of membrane properties in hair cells isolated from the turtle cochlea. J Physiol (Lond) 385: 207–242. - PMC - PubMed
    1. Augustine GJ, Adler EM, Charlton MP (1991) The calcium signal for transmitter secretion from presynaptic nerve terminals. Ann NY Acad Sci 635: 365–381. - PubMed
    1. Augustine GJ, Santamaria F, Tanaka K (2003) Local calcium signaling in neurons. Neuron 40: 331–346. - PubMed
    1. Beutner D, Voets T, Neher E, Moser T (2001) Calcium dependence of exocytosis and endocytosis at the cochlear inner hair cell afferent synapse. Neuron 29: 681–690. - PubMed
    1. Brandt A, Striessnig J, Moser T (2003) CaV1.3 channels are essential for development and presynaptic activity of cochlear inner hair cells. J Neurosci 23: 10832–10840. - PMC - PubMed

Publication types

MeSH terms

Substances