Comparative Study
. 2005 Dec 14;25(50):11693-709.
doi: 10.1523/JNEUROSCI.2766-05.2005.

BACE1, a major determinant of selective vulnerability of the brain to amyloid-beta amyloidogenesis, is essential for cognitive, emotional, and synaptic functions

Affiliations
Comparative Study

BACE1, a major determinant of selective vulnerability of the brain to amyloid-beta amyloidogenesis, is essential for cognitive, emotional, and synaptic functions

Fiona M Laird et al. J Neurosci. .

Abstract

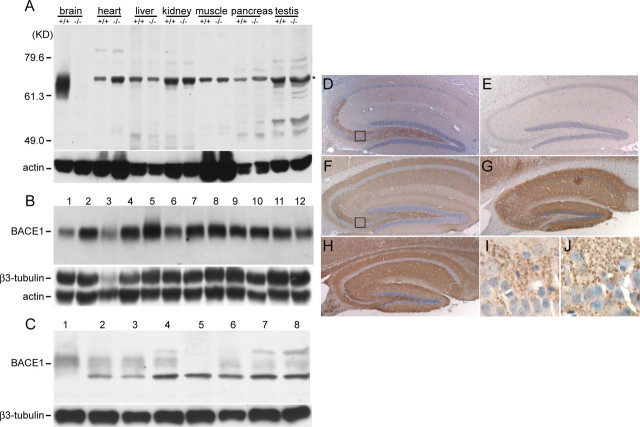
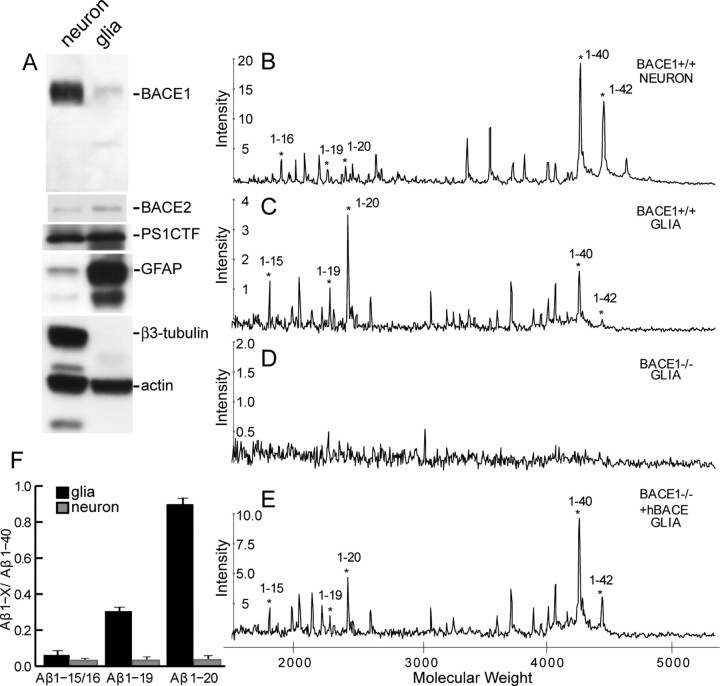
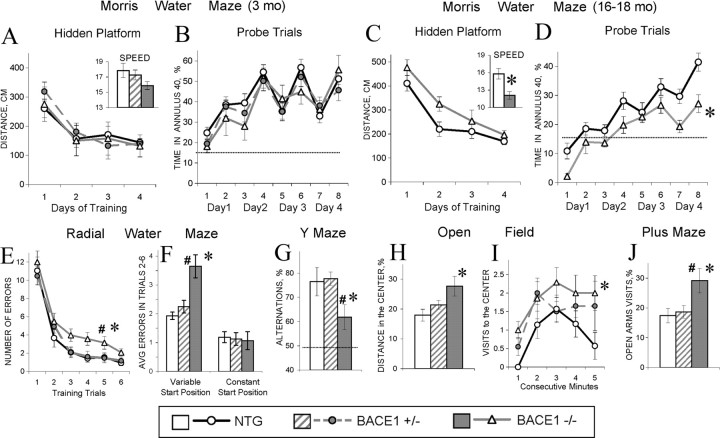
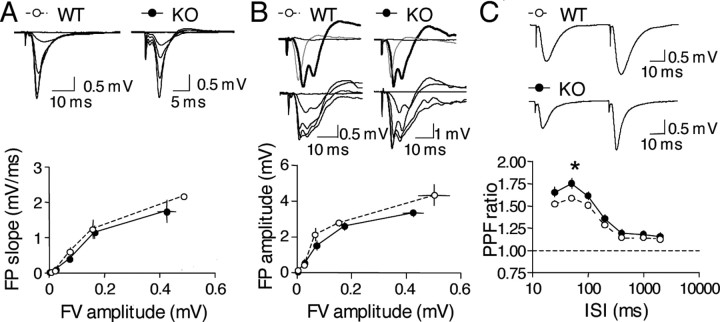
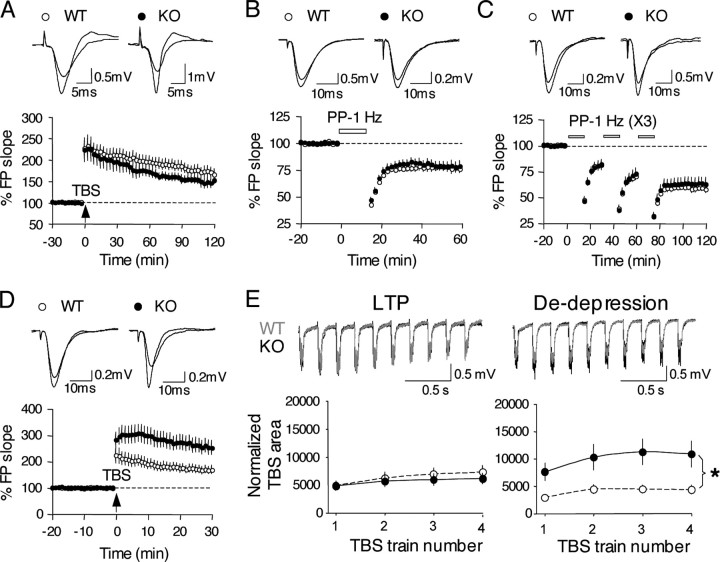
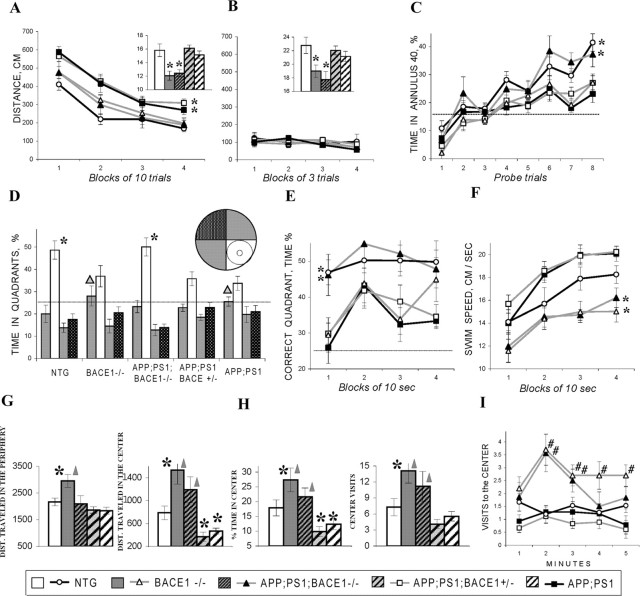
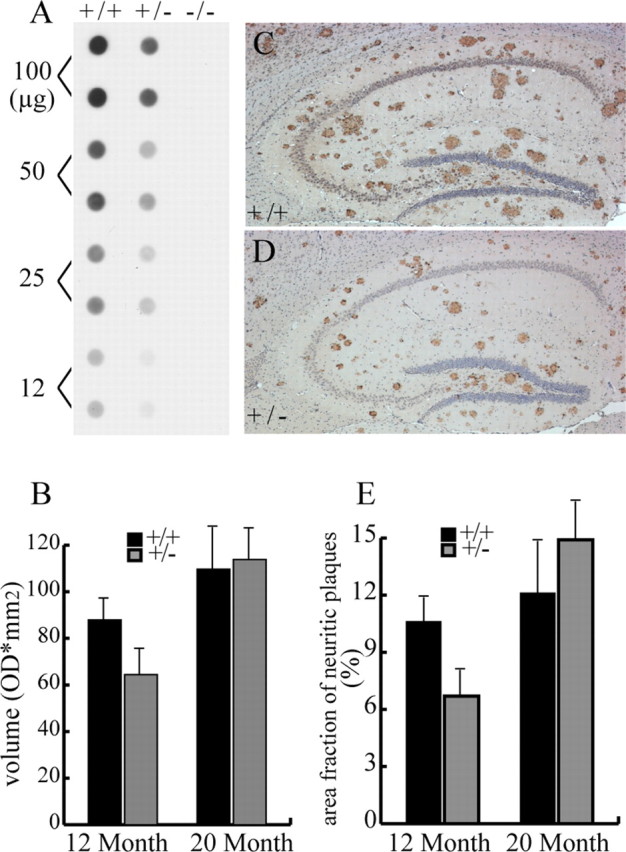
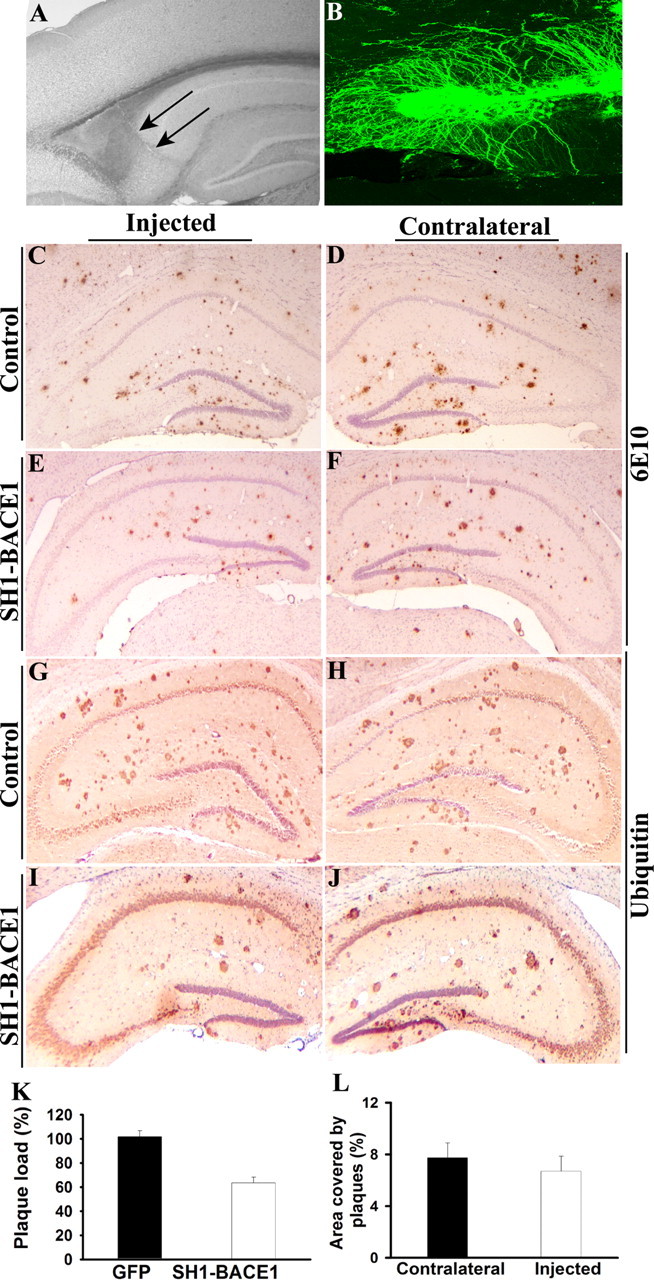
A transmembrane aspartyl protease termed beta-site APP cleavage enzyme 1 (BACE1) that cleaves the amyloid-beta precursor protein (APP), which is abundant in neurons, is required for the generation of amyloid-beta (Abeta) peptides implicated in the pathogenesis of Alzheimer's disease (AD). We now demonstrate that BACE1, enriched in neurons of the CNS, is a major determinant that predisposes the brain to Abeta amyloidogenesis. The physiologically high levels of BACE1 activity coupled with low levels of BACE2 and alpha-secretase anti-amyloidogenic activities in neurons is a major contributor to the accumulation of Abeta in the CNS, whereas other organs are spared. Significantly, deletion of BACE1 in APPswe;PS1DeltaE9 mice prevents both Abeta deposition and age-associated cognitive abnormalities that occur in this model of Abeta amyloidosis. Moreover, Abeta deposits are sensitive to BACE1 dosage and can be efficiently cleared from the CNS when BACE1 is silenced. However, BACE1 null mice manifest alterations in hippocampal synaptic plasticity as well as in performance on tests of cognition and emotion. Importantly, memory deficits but not emotional alterations in BACE1(-/-) mice are prevented by coexpressing APPswe;PS1DeltaE9 transgenes, indicating that other potential substrates of BACE1 may affect neural circuits related to emotion. Our results establish BACE1 and APP processing pathways as critical for cognitive, emotional, and synaptic functions, and future studies should be alert to potential mechanism-based side effects that may occur with BACE1 inhibitors designed to ameliorate Abeta amyloidosis in AD.


Figures

Figure 1.
Figure 1.
Selective accumulation of BACE1 in the brain. A, Protein extracts (50 μg each) from different organs of littermate BACE1+/+ and BACE1/ mice were immunoblotted with anti-BACE1 fusion protein antibody and reprobed with antisera against actin. Note that BACE1 was most abundant in brain. B, Protein extracts (100 μg each) from different regions in the CNS of newborn mice (Chemicon) were immunoblotted using the same antiserum against BACE1 as in A and reprobed with antiserum against actin and β3-tubulin. 1, Frontal cortex; 2, posterior cortex; 3, cerebellum; 4, hippocampus; 5, olfactory bulb; 6, striatum; 7, thalamus; 8, midbrain; 9, entorhinal cortex; 10, pons; 11, medulla; 12, spinal cord. C, Protein extracts (25 μg each) prepared from seven different regions in the CNS of adult mice were used for examining the expression levels of BACE1 protein. As control, the same membrane was stripped and blotted with β3-tubulin antibodies. BACE1+/+ tissue from the following: 1, olfactory bulb; 2, cortex; 3, hippocampus; 4, thalamus; 6, cerebellum; 7, brain stem; 8, spinal cord; as a control, cortex from BACE1/ was loaded in lane 5. D, E, BACE1 immunoreactivities were localized to the hippocampal hilus of the dentate gyrus and stratum lucidum of BACE1+/+ mice (D); no signal was observed in BACE1/ mice (E). F–H, Antibodies specific to synaptophysin (F) or syntaxin1 (H) immunostained the projection of hippocampal axons and their presynaptic terminals, where as the projection of hippocampal dendrites was revealed by MAP2 immunostaining (G) from BACE1+/+ mice. Higher magnification of the boxed area in D and F showed, respectively, BACE1 (I) and synaptophysin (J) immunoreactivities localized to giant boutons of hippocampal mossy fibers. All sagittal sections (10 μm) were counterstained with hematoxylin and eosin.
Figure 2.
Figure 2.
Comparison of activity levels of BACE1, BACE2, and α-secretase in cultured neurons and astrocytes. A, Protein extracts (20μg each) from cultured cortical neurons and astrocytes were immunoblotted using antiserum against BACE1, BACE2, PS1, neuron-specific β3-tublin, and glia-specific GFAP. Note that BACE1 was more abundant in neurons compared with glial cells, whereas BACE2 was more abundant in glial cells; PS1 levels in neurons were similar to that of glial cells. B–E, Mass spectrometric analysis of secreted human Aβ peptides from conditioned media of cultured neurons (B) and glial cells (C–E) infected with adenovirus expressing APPswe using PS1 Ciphergen ProteinChip system coated with 6E10, a monoclonal antibody specific to N termini of human Aβ peptides. The asterisks denote peaks corresponding to human Aβ peptides; the mass of each peptide is in parentheses. M/Z, Mass-to-charge ratio. F, The signal intensities of Aβ1–15, Aβ1–16, Aβ1–19, and Aβ1–20 were normalized to that of Aβ1–40, and the ratio is plotted as a function of type of cells. Note that cultured astrocytes showed higher levels of BACE2 and α-secretase activities than that of cultured neurons (n = 4; p < 0.001, Student's t test).
Figure 3.
Figure 3.
Cognitive and emotional deficits in BACE1/ mice. A–D, Testing of spatial reference memory in the Morris water maze. Distance to the platform (A, C) and percentage of time spent in annulus 40 around the platform (B, D) in 3-month-old (A, B) and 16- to 18-month-old (C, D) mice. Insets show swim speed averaged for all platform trails. E–J, Data for 3-month-old mice. E–G, Testing of spatial working memory in 3-month-old mice. Learning of a daily new platform position in the radial water maze (E) shown as a number of errors averaged for a 6 d training for every trial. Number of errors in the radial water maze (F) averaged for trials 2–6; start position for every trial either varied (left columns) or remain constant, allowing the same viewpoint across the trials (right columns). Percentage of spontaneous arms alternation in the Y-maze task is indicated (G). H–J, Testing of anxiety in 3-month-old mice. Percentage of distance traveled in the central (more aversive) parts of the open field (H). Dynamics of visits to the center during a 5 min test (I). Percentage of visits to the open arm of the plus maze (J). The asterisks and pound signs (C–J) indicate significant differences (p < 0.05) from control and BACE1+/ mice, respectively, as a result of Newman–Keuls post hoc tests applied to significant effect of genotype (ANOVAs, p < 0.05). Dotted lines show chance levels of performance (B, D, G). A table summarizing these behavioral findings is available in supplemental Figure S3 (available at www.jneurosci.org as supplemental material). NTG, Nontransgenic mice.
Figure 4.
Figure 4.
Characterization of basal synaptic transmissionin BACE1 knock-outs. A, No change in AMPA receptor-mediated basal synaptic transmission in BACE1/ mice. Input–output curves were generated by gradually increasing stimulus intensity and measuring the initial slope of the field potentials (FP) for BACE1+/+ mice (WT, open circles) and BACE1/ mice (KO, filled circles) (left panel). The measured field potential slopes are plotted against the amplitude of presynaptic fiber volley, a measure of presynaptic action potentials. Example field potential traces taken at each stimulation intensities are shown for both BACE1+/+ mice and BACE1/ mice on the right side. B, Normal NMDA receptor-mediated basal synaptic transmission in BACE1/ mice. Pharmacologically isolated NMDA receptor-mediated synaptic transmission was measured by generating input–output curves at different stimulation intensities. NMDA receptor-mediated field potential amplitudes are plotted against the amplitude of presynaptic fiber volley for both BACE1+/+ mice (open circles) and BACE1/ mice (KO, filled circles), as shown in the bottom panel. Example field potential traces are shown in the top panel. Top two traces show the pharmacological isolation of NMDA receptor-mediated responses in BACE1+/+ mice and BACE1/ mice. Gray traces are AMPA receptor-mediated responses recorded in normal ACSF. Thick black traces are field potentials after switching to ACSF with 0 mm Mg2+ and 10 mm NBQX to isolate NMDA receptor-mediated responses. At the end of all experiments, 100 μm APV was added, which completely blocked the NMDA receptor-mediated field potentials (thin black traces). The bottom two traces show input–output curves of NMDA receptor-mediated field potentials from BACE1+/+ mice (left) and BACE1/ mice (right). C, An increase in PPF ratio in the BACE1/ mice. PPF ratio was measured at different ISIs, as shown in the bottom panel. Example field potential traces taken at an ISI of 50 ms are shown for both BACE1+/+ mice and BACE1/ mice in the top panel.
Figure 5.
Figure 5.
Synaptic plasticity in BACE1/ mice. A, No change in LTP in BACE1/ mice. Grouped averages are shown on the left graph. There is no difference in LTP magnitude in BACE1/ mice (filled circles) compared with BACE1+/+ mice (open circles). Example field potential traces taken before and 2 h after TBS are overlapped and shown in the right panel for both BACE1+/+ mice (left) and BACE1/ mice (right). B, No change in LTD in BACE1/ mice. LTD induced by PP-1 Hz (15 min, ISI of 50 ms) are shown for BACE1+/+ mice (open circles) and BACE1/ mice (filled circles). Example field potential traces taken before and 1 h after the onset of PP-1 Hz are shown in the right panel. C, No difference in LTD saturation in BACE1/ mice. Three episodes of PP-1 Hz (15 min, ISI of 50 ms) were repeated at 15 min intervals to saturate LTD in both BACE1+/+ mice (open circles) and BACE1/ mice (filled circles). Top panel shows example field potential traces taken from the baseline and 1 h after the onset of the third PP-1 Hz overlapped for both BACE1+/+ mice (left) and BACE1/ mice (right) for comparison. D, Larger de-depression (LTD reversal) in the BACE1/ mice. After the saturation of LTD (shown in C), TBS was delivered to induce de-depression. Bottom panel shows the average data in which BACE1/ mice (filled circles) show a significantly larger de-depression compared with BACE1+/+ mice (open circles). Base line in this graph was renormalized to the 20 min before TBS for better comparison. Example traces taken before TBS and 30 min afterward are overlapped for comparison for BACE1+/+ mice (left) and BACE1/ mice (right). E, Larger summation of TBS responses only during the de-depression in the BACE1/ mice. Responses during TBS were compared between BACE1+/+ and BACE1/ during LTP and de-depression induction. Top panel shows example traces taken from the first train of TBS. The traces were taken to match the initial field potential size. Traces from BACE1+/+ (gray lines) and traces from BACE1/ (black lines) are overlapped for comparison. Note larger responses in BACE1/ during the de-depression. To quantify these differences, the area under the TBS responses were calculated and normalized to the area under a single field potential (bottom panel). There was a significant increase in the normalized TBS area from the BACE1/ mice only during the de-depression compared with BACE1+/+ mice. The asterisk indicates statistically significant difference in normalized TBS area during all four TBS trains. KO, Knock-out mice; WT, wild-type mice.
Figure 6.
Figure 6.
Analyses of cognitive and emotional behaviors in aged BACE1/, APPswe;PS1ΔE9, and APPswe;PS1ΔE9;BACE1/ mice. A–F, Cognitive deficits present in aged (16–18 months) BACE1/ and APPswe;PS1ΔE9 mice but absent in APPswe;PS1ΔE9;BACE1/ mice. Distance to find the platform is shown for consecutive blocks of “platform” trials in which the platform was available but hidden under the milky water (A). Inset shows an average swimming speed during platform trials. Note that BACE1/ and APPswe;PS1ΔE9;BACE1/ mice swam significantly slower than all other groups. No between-group differences were observed in distance to find the platform when it was made visible by a high-contrast extension (B). Inset shows that BACE1/ and APPswe;PS1ΔE9;BACE1/ mice swim slower than other groups similar to that observed in hidden platform trials (see A). Spatial preferences for the hidden platform location tested in the “probe” trials (C–F) in which the platform was lowered and inaccessible for the mouse for a variable interval (30–40 s). Acquisition of spatial preference is shown as a percentage of time spent in annulus 40 in consecutive probe trials (C) conducted before and after each block of 10 platform trials (shown in A). Nontransgenic controls and APPswe;PS1ΔE9;BACE1/ mice acquired significantly higher preference for the platform location compared with all other groups. Percentage of time spent in different quadrants of the water maze during the last probe trial (D). Inset in D shows the scheme of quadrants in the water maze. The small circle indicates the location of the hidden platform, and the larger circle shows a borderline of annulus 40, an area of 40 cm in diameter centered around the platform. Nontransgenic and APPswe;PS1ΔE9;BACE1/ mice swam predominantly in the correct quadrant (white bars), whereas the spatial preferences in other groups were significantly lower and distributed between the correct and one of the adjacent (gray bars) quadrants. The triangles indicate that the preferences for the correct and one of the adjacent quadrants are not different (p > 0.2). Preference for the correct quadrant is shown in consecutive blocks of 10 s in the last probe trial (E). The spatial preferences were stable in nontransgenic and APPswe;PS1ΔE9;BACE1/ mice but not in other groups. In all genotypes, swim speed increased in the course of the probe trial (F). BACE1/ and APPswe;PS1ΔE9;BACE1/ mice swam consistently slower than other groups (see also insets in A and B). The asterisks in A and C–F indicate a significant difference from other groups as determined by Newman–Keuls post hoc test applied to a significant effect of group (ANOVA, p < 0.05). Dotted lines in C–E show chance levels of performance for the variables used. G–I, Anxiolytic phenotypes present in BACE1/ and APPswe;PS1ΔE9; BACE1/ mice in the open-field test. Integral measures of activity (G) and anxiety (H) averaged for whole duration of testing (5 min) is shown. The asterisks and triangles indicate a significant difference from nontransgenics (NTG) and APPswe;PS1ΔE9 mice, respectively, as a result of Newman–Keuls post hoc test applied to significant effect of group (ANOVAs, p < 0.01). Note that BACE1/ and APPswe;PS1ΔE9 mice had contrasting deficits in distance, time, and number of visits to the central part of the open field, indicating low and high anxiety levels, respectively. Dynamics of visits to the central part of the open field (I) are shown for consecutive minutes of testing. Pound signs indicate significant differences from nontransgenic group as a result of Newman–Keuls post hoc test (p < 0.05) applied to significant group × minute interaction (ANOVA, F(16,252) = 1.75; p < 0.05).
Figure 7.
Figure 7.
Reduced Aβ burden in young, but not aged, APPswe;PS1ΔE9 BACE1+/ mice. A, Analysis of Aβ aggregates using the filter trap assay from brains of 12-month-old APPswe;PS1ΔE9;BACE1/, APPswe;PS1ΔE9;BACE1+/, and APPswe;PS1ΔE9;BACE1+/+ mice. As expected, no signals were detected in APPswe;PS1ΔE9;BACE1+/+ mice. B, Quantitative analysis of the levels of Aβ aggregation in the brains of five pairs each of APPswe;PS1ΔE9;BACE1+/+ and APPswe;PS1ΔE9;BACE1+/ mice at 12 and 20 months of age using the filter trap assay. OD, Optical density. C, D, Sagittal brain sections (10 μm) from 12-month-old APPswe;PS1ΔE9;BACE1+/+ (C) and APPswe;PS1ΔE9;BACE1+/ (D) immunostained with antibodies specific to ubiquitin. E, Unbiased stereological analysis of brain surface areas covered by neuritic plaques from 12-month-old (n = 7) and 20-month-old (n = 7) APPswe;PS1ΔE9;BACE1+/+ and APPswe;PS1ΔE9;BACE1+/ mice.
Figure 8.
Figure 8.
Silencing BACE1 through RNAi ameliorates Aβ amyloidosis in the hippocampus of APPswe/PS1ΔE9 mice. A, A representative unstained bright-field image showing the needle track (arrows) after injection of LV. B, LV-SH1-BACE1, which coexpresses a reporter GFP, was stereotaxically injected into dentate gyrus of adult mouse hippocampus. Numerous cells in the dentate gyrus with neuronal morphology were GFP positive. C–F, Coronal hippocampal sections of 18-month-old APPswe/PS1ΔE9 mice immunostained with monoclonal 6E10 specific to Aβ and unilaterally injected with LV-GFP (C, D) or LV-SH1-BACE1 (E, F). C and E are ipsilateral to injection sites, and D and F are contralateral to injection sites. G–J, Coronal hippocampal sections of 13- to 14-month-old APPswe/PS1ΔE9 mice immunostained with antibody specific to ubiquitin and unilaterally injected with LV-GFP (G, H) or LV-SH1-BACE1 (I, J). G and I are ipsilateral to injection sites, and H and J are contralateral to injection sites. K, Unbiased stereological analysis of ubiquitin-stained hippocampal sections of 13- to 18-month-old APPswe/PS1ΔE9 mice. The percentage area covered by neuritic plaques in injected side was normalized to the contralateral side for each mouse. The black bar ± SEM represents control injections (LV-GFP, n = 5), and the white bar ± SEM represents LV-SH1-BACE1 (n = 5). Pairwise comparison using Student's t test, p < 0.0006. L, The percentage area covered by neuritic plaques was determined in the cortex above the hippocampus in the same sections as in K. The black bar ± SEM represents contralateral sides (n = 3), and the white bar ± SEM is ipsilateral sides to LV-SH1-BACE1 injections (n = 3). Pairwise comparison using Student's t test, p = 0.558.

References

    1. Abeliovich A, Chen C, Goda Y, Silva AJ, Stevens CF, Tonegawa S (1993) Modified hippocampal long-term potentiation in PKC gamma-mutant mice. Cell 75: 1253–1262. - PubMed
    1. Allinson TM, Parkin ET, Turner AJ, Hooper NM (2003) ADAMs family members as amyloid precursor protein alpha-secretases. J Neurosci Res 74: 342–352. - PubMed
    1. Andreasson KI, Savonenko A, Vidensky S, Goellner JJ, Zhang Y, Shaffer A, Kaufmann WE, Worley PF, Isakson P, Markowska AL (2001) Age-dependent cognitive deficits and neuronal apoptosis in cyclooxygenase-2 transgenic mice. J Neurosci 21: 8198–8209. - PMC - PubMed
    1. Arendash GW, King DL, Gordon MN, Morgan D, Hatcher JM, Hope CE, Diamond DM (2001) Progressive, age-related behavioral impairments in transgenic mice carrying both mutant amyloid precursor protein and presenilin-1 transgenes. Brain Res 891: 42–53. - PubMed
    1. Ashe KH (2001) Learning and memory in transgenic mice modeling Alzheimer's disease. Learn Mem 8: 301–308. - PubMed

Publication types

MeSH terms

LinkOut - more resources