Comparative Study
. 2005 Dec 14;25(50):11730-7.
doi: 10.1523/JNEUROSCI.3286-05.2005.

Trial-by-trial coupling of concurrent electroencephalogram and functional magnetic resonance imaging identifies the dynamics of performance monitoring

Affiliations
Comparative Study

Trial-by-trial coupling of concurrent electroencephalogram and functional magnetic resonance imaging identifies the dynamics of performance monitoring

Stefan Debener et al. J Neurosci. .

Abstract

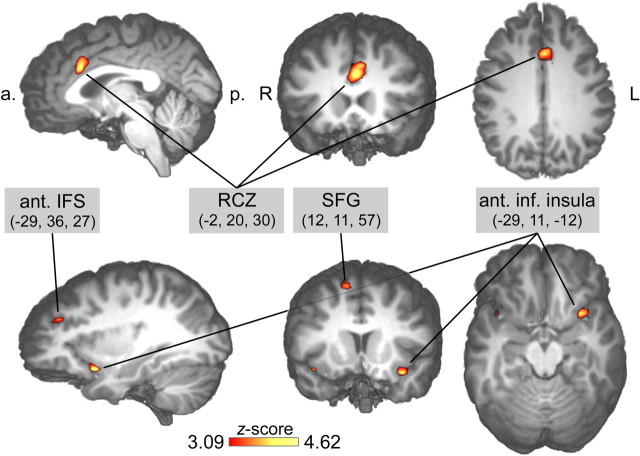
Goal-directed behavior requires the continuous monitoring and dynamic adjustment of ongoing actions. Here, we report a direct coupling between the event-related electroencephalogram (EEG), functional magnetic resonance imaging (fMRI), and behavioral measures of performance monitoring in humans. By applying independent component analysis to EEG signals recorded simultaneously with fMRI, we found the single-trial error-related negativity of the EEG to be systematically related to behavior in the subsequent trial, thereby reflecting immediate behavioral adjustments of a cognitive performance monitoring system. Moreover, this trial-by-trial EEG measure of performance monitoring predicted the fMRI activity in the rostral cingulate zone, a brain region thought to play a key role in processing of response errors. We conclude that investigations of the dynamic coupling between EEG and fMRI provide a powerful approach for the study of higher order brain functions.


Figures

Figure 1.
Figure 1.
Sequence of stimulus events in the speeded flanker task. Participants viewed four task-irrelevant flanker arrows, followed by a central arrow that indicated the response direction and pointed to the same or opposite direction as flanker arrows. Compatible (same direction) and incompatible (opposite direction) trials appeared in randomized order and with the same probability. For trials in which subjects responded slower than a dynamically adapting individual response deadline, a symbolic feedback occurred urging the subject to speed up in consecutive trials.
Figure 2.
Figure 2.
The selected ICs are equivalent to the scalp-recorded ERN. a, Identified components were characterized by a radial central topography. Depicted is the grand mean IC topography, after root-mean-square normalization (arbitrary units). b, Grand average (n = 13 subjects) IC activation ERPs for the vertex electrode (Cz), time-locked to response-onset times, revealed the ERN in the incompatible error condition. Negativity is plotted upwards. c, Informed dipole seeding of the grand mean IC topography shown in a, at Talairach coordinates (x, y, z) = 0, 20, 30. This location was derived from standard analysis of the concurrently recorded fMRI contrasting incompatible error and incompatible correct trials. The equivalent current dipole, which explained 90.2% of the variance, is plotted on a canonical magnetic resonance image template of the human head. RV, Residual variance. d, ERP-image plot of IC incompatible error trials at vertex electrode (Cz) aligned to stimulus onset (0). Sorting the trials by reaction time (sigmoid white line) and smoothing with a moving average across 30 trials visualizes the ERN–reaction time relationship. e, Time–frequency analysis of the total power difference (in decibels) between IC incompatible error and incompatible correct trials. Significantly more theta activity for the error condition is indicated by the black contour line. The white vertical lines denote the stimulus onset time (0 ms) and mean reaction time for erroneous responses, respectively.
Figure 3.
Figure 3.
a, Quantification of IC single-trial amplitudes exemplified for three trials from the three different conditions. The color code is as in d. The mean of the ERN preceding (–80–0 ms) and after (85–240 ms) positive peaks was subtracted from the negative peak occurring after each button-press (15–85 ms), giving an amplitude for every single trial. The numbers state the corresponding single-trial amplitude. b, Resulting single-trial amplitudes for a representative subject over the course of ∼250 trials (of 400 trials in total). For visualization, the single single-trial amplitude values are color-coded according to the stimulus–response condition. The color code is as in d. Note the considerable amount of variance within each experimental condition presumably reflecting the varying strength of performance monitoring. c, Single-subject example showing for the incompatible error condition the relationship between single-trial amplitude and reaction time, separately for the current trial (open circles; dashed regression curve) and for the reaction time of the following trial (filled squares; solid regression curve). d, Second-level result across all n = 13 subjects, showing the mean reaction time to single-trial amplitudes slope (+SEM) for all three conditions after removal of outlier (>3 SD) and late feedback trials, separately for the same trial and for the next trial. *p < 0.05.
Figure 4.
Figure 4.
Result of the EEG-informed parametric fMRI analysis based on IC single-trial amplitudes, plotted on an individual brain. fMRI signals correlated with single-trial amplitudes solely in the RCZ along the banks of the cingulate sulcus [center of gravity at coordinates (x, y, z) = 0, 17, 42; z =–3.86]. The left part shows coronal view; the right part shows the sagittal view on the right hemisphere. The red lines on the middle top view inset indicate slice sections. R, Right; L, left; A, anterior; P, posterior.
Figure 5.
Figure 5.
Significant error-related fMRI activations revealed by the conventional random effects analysis contrasting conditions incompatible error versus incompatible correct. a., Anterior; p., posterior; R, right; L, left; ant., anterior; inf., inferior; SFG, superior frontal gyrus; IFS, inferior frontal sulcus.

References

    1. Aguirre GK, Zarahn E, D'Esposito M (1997) Empirical analyses of BOLD fMRI statistics. II. Spatially smoothed data collected under null-hypothesis and experimental conditions. NeuroImage 5: 199–212. - PubMed
    1. Allen PJ, Polizzi G, Krakow K, Fish DR, Lemieux L (1998) Identification of EEG events in the MR scanner: the problem of pulse artifact and a method for its subtraction. NeuroImage 8: 229–239. - PubMed
    1. Allen PJ, Josephs O, Turner R (2000) A method for removing imaging artifact from continuous EEG recorded during functional MRI. NeuroImage 12: 230–239. - PubMed
    1. Arieli A, Sterkin A, Grinvald A, Aertsen A (1996) Dynamics of ongoing activity: explanation of the large variability in evoked cortical responses. Science 273: 1868–1871. - PubMed
    1. Bell AJ, Sejnowski TJ (1995) An information-maximization approach to blind separation and blind deconvolution. Neural Comput 7: 1129–1159. - PubMed

Publication types