. 2006;8(1):R2.
doi: 10.1186/ar1846.

Differential direct effects of cyclo-oxygenase-1/2 inhibition on proteoglycan turnover of human osteoarthritic cartilage: an in vitro study

Affiliations

Differential direct effects of cyclo-oxygenase-1/2 inhibition on proteoglycan turnover of human osteoarthritic cartilage: an in vitro study

Simon C Mastbergen et al. Arthritis Res Ther. 2006.

Abstract

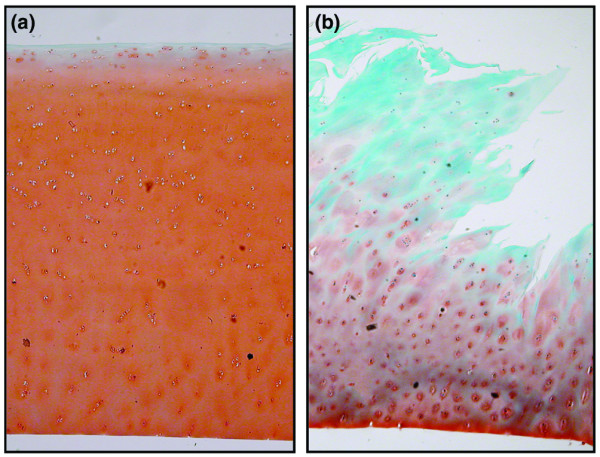
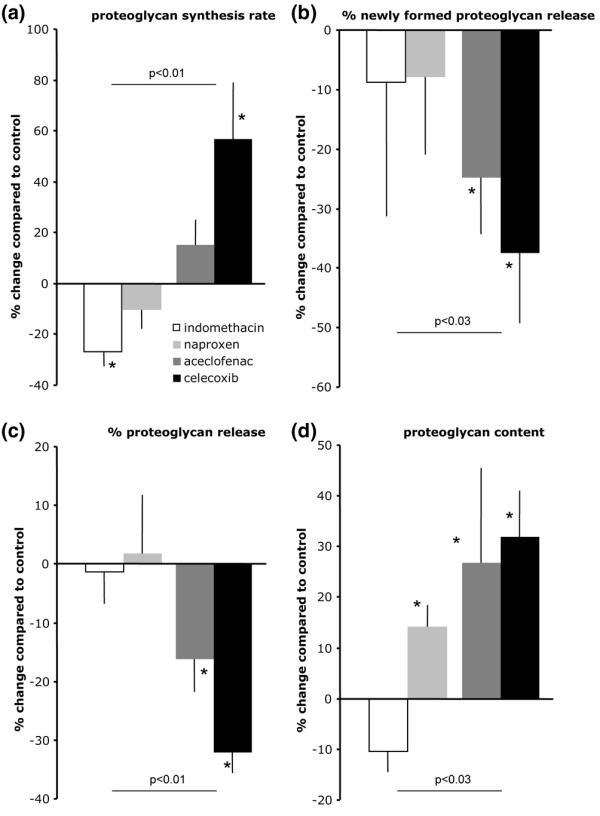
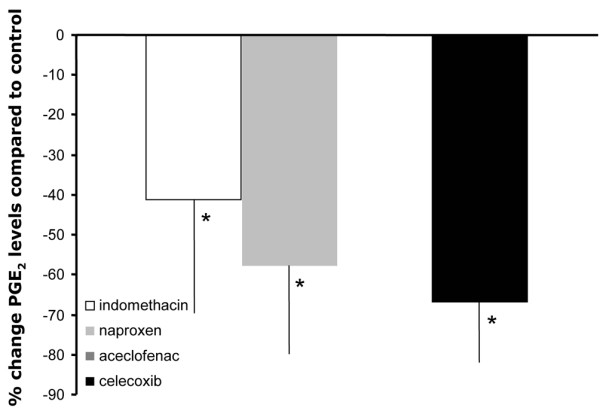
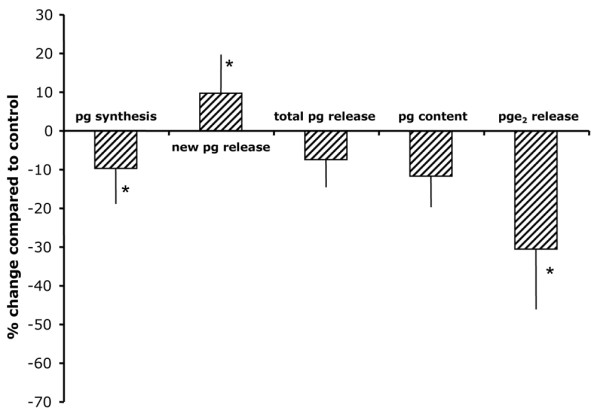
Treatment of osteoarthritis (OA) with nonsteroidal anti-inflammatory drugs (NSAIDs) diminishes inflammation along with mediators of cartilage destruction. However, NSAIDs may exert adverse direct effects on cartilage, particularly if treatment is prolonged. We therefore compared the direct effects of indomethacin, naproxen, aceclofenac and celecoxib on matrix turnover in human OA cartilage tissue. Human clinically defined OA cartilage from five different donors was exposed for 7 days in culture to indomethacin, naproxen, aceclofenac and celecoxib--agents chosen based on their cyclo-oxygenase (COX)-2 selectivity. As a control, SC-560 (a selective COX-1 inhibitor) was used. Changes in cartilage proteoglycan turnover and prostaglandin E2 production were determined. OA cartilage exhibited characteristic proteoglycan turnover. Indomethacin further inhibited proteoglycan synthesis; no significant effect of indomethacin on proteoglycan release was found, and proteoglycan content tended to decrease. Naproxen treatment was not associated with changes in any parameter. In contrast, aceclofenac and, prominently, celecoxib had beneficial effects on OA cartilage. Both were associated with increased proteoglycan synthesis and normalized release. Importantly, both NSAIDs improved proteoglycan content. Inhibition of prostaglandin E2 production indirectly showed that all NSAIDs inhibited COX, with the more COX-2 specific agents having more pronounced effects. Selective COX-1 inhibition resulted in adverse effects on all parameters, and prostaglandin E2 production was only mildly inhibited. NSAIDs with low COX-2/COX-1 selectivity exhibit adverse direct effects on OA cartilage, whereas high COX-2/COX-1 selective NSAIDs did not show such effects and might even have cartilage reparative properties.


Figures

Figure 1
Figure 1
Normal healthy and osteoarthritic cartilage histology. Representive light micrographs of condylar cartilage obtained post mortem from joints with (a) normal healthy cartilage and (b) cartilage obtained at joint replacement surgery. Sections are stained with safranin-O fast green-iron haematoxylin and graded for features of osteoarthritis according to the slightly modified criteria [23] described by Mankin and coworkers [24]; scores for the shown samples are 0 and 7, respectively.
Figure 2
Figure 2
Effects of four NSAIDs on proteoglycan turnover and content of OA cartilage. Shown are the following measures of proteoglycan turnover: (a) percentage change in proteoglycan synthesis rate (compared with untreated osteoarthritic cartilage of the same donor), as a measure of cartilage matrix synthesis (proteoglycan synthesis); (b) percentage release of newly formed proteoglycans (new proteoglycan release), as a measure of retention of newly formed proteoglycans (normalized to the synthesis of these proteoglycans); (c) percentage total release of proteoglycans (total proteoglycan release), measured as the percentage release of glycosaminoglycans (normalized to the glycosaminoglycan content); and (d) proteoglycan content (proteoglycan content). White bars represent effects of indomethacin (10 μmol/l); light grey bars represent naproxen (300 μmol/l), dark grey bars represent aceclofenac (0.03 μmol/l) and black bars represent celecoxib (1 μmol/l). The results are presented as means of five experiments (with each cartilage sample from the different donors) ± standard error. Statistically significant differences for the effect of an NSAID compared with OA cartilage of the same donors is calculated using nonparametric paired analysis (*P < 0.05). Difference between percentage changes for the two nonselective NSAIDs compared with the (more) selective NSAIDs (n = 10 versus n = 10) is calculated by nonparametric, nonpaired analysis (P values are given for each of the parameters). NSAID, nonsteroidal anti-inflammatory drug; OA, osteoarthritis.
Figure 3
Figure 3
Effects of three of the four NSAIDs on PGE2 production in OA cartilage. Percentage changes in PGE2 levels in culture supernatants of osteoarthritic cartilage treated with different NSAIDs are shown. Mean values (n = 5 ± standard error) are presented for indomethacin (open bar), naproxen (light grey bar) and celecoxib (black bar). Effects of aceclofenac were not measured. Statistical differences of the effects of the different NSAIDs compared with untreated controls were calculated using nonparametric paired analysis (*P < 0.05). NSAID, nonsteroidal anti-inflammatory drug; OA, osteoarthritis; PG, prostaglandin.
Figure 4
Figure 4
Effect of a selective COX-1 inhibition on OA cartilage. Shown are the percentage changes compared with healthy cartilage of proteoglycan synthesis rate as a measure of cartilage matrix synthesis (pg synthesis); percentage release of newly formed proteoglycans (new pg release) as a measure of retention of the newly formed proteoglycans (normalized to the synthesis of these proteoglycans); percentages total release of proteoglycans (total pg release), measured as the percentage release of glycosaminoglycans (normalized to glycosaminoglycan content); proteoglycan content (pg content) and prostaglandin E2 release (pge2 release) under the influence of 0.1 μmol/l SC-560 (a selective COX-1 inhibitor). The results are presented as means of five experiments (with each cartilage sample from the different donors) ± standard error. The absolute values of untreated controls are as follows: prostaglandin synthesis rate 3.4 ± 1.3 nmol/hour per g; % new prostaglandin release 11.4 ± 0.6%; total prostaglandin release 6.4 ± 1.1%; and prostaglandin content 17.9 ± 0.8 mg/g. Significant differences between SC-560 treated and untreated cartilage were calculated using nonparametric paired analysis (*P < 0.05).

References

    1. Hungin AP, Kean WF. Nonsteroidal anti-inflammatory drugs: overused or underused in osteoarthritis? Am J Med. 2001;110:8S–11S. doi: 10.1016/S0002-9343(00)00628-8. - DOI - PubMed
    1. Dieppe PA, Lohmander LS. Pathogenesis and management of pain in osteoarthritis. Lancet. 2005;365:965–973. doi: 10.1016/S0140-6736(05)71086-2. - DOI - PubMed
    1. Goldring MB. The role of the chondrocyte in osteoarthritis. Arthritis Rheum. 2000;43:1916–1926. doi: 10.1002/1529-0131(200009)43:9<1916::AID-ANR2>3.0.CO;2-I. - DOI - PubMed
    1. Lazzaroni M, Bianchi Porro G. Gastrointestinal side-effects of traditional non-steroidal anti-inflammatory drugs and new formulations. Aliment Pharmacol Ther. 2004;20 Suppl 2:48–58. doi: 10.1111/j.1365-2036.2004.02037.x. - DOI - PubMed
    1. Bombardier C, Laine L, Reicin A, Shapiro D, Burgos-Vargas R, Davis B, Day R, Ferraz MB, Hawkey CJ, Hochberg MC, et al. Comparison of upper gastrointestinal toxicity of rofecoxib and naproxen in patients with rheumatoid arthritis. VIGOR Study Group. N Engl J Med. 2000;343:1520–1528. doi: 10.1056/NEJM200011233432103. - DOI - PubMed

Publication types

MeSH terms