

A comparison of admission and worst 24-hour Acute Physiology and Chronic Health Evaluation II scores in predicting hospital mortality: a retrospective cohort study
- PMID: 16356207
- PMCID: PMC1550848
- DOI: 10.1186/cc3913
A comparison of admission and worst 24-hour Acute Physiology and Chronic Health Evaluation II scores in predicting hospital mortality: a retrospective cohort study
Abstract
Introduction: The Acute Physiology and Chronic Health Evaluation (APACHE) II score is widely used in the intensive care unit (ICU) as a scoring system for research and clinical audit purposes. Physiological data for calculation of the APACHE II score are derived from the worst values in the first 24 hours after admission to the ICU. The collection of physiological data on admission only is probably logistically easier, and this approach is used by some ICUs. This study compares the performance of APACHE II scores calculated using admission data with those obtained from the worst values in the first 24 hours.
Materials and methods: This was a retrospective cohort study using prospectively collected data from a tertiary ICU. There were no missing physiological data and follow-up for mortality was available for all patients in the database. The admission and the worst 24-hour physiological variables were used to generate the admission APACHE II score and the worst 24-hour APACHE II score, and the corresponding predicted mortality, respectively.
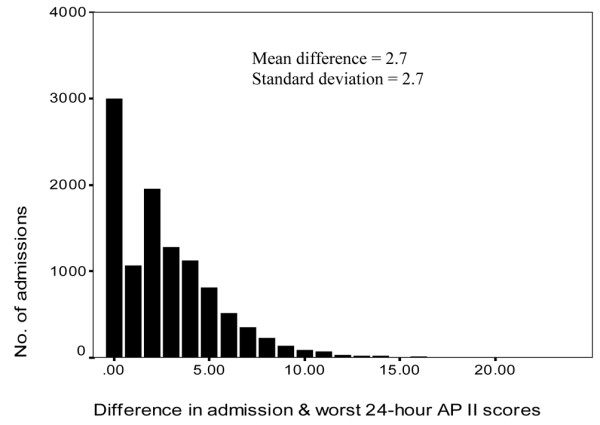
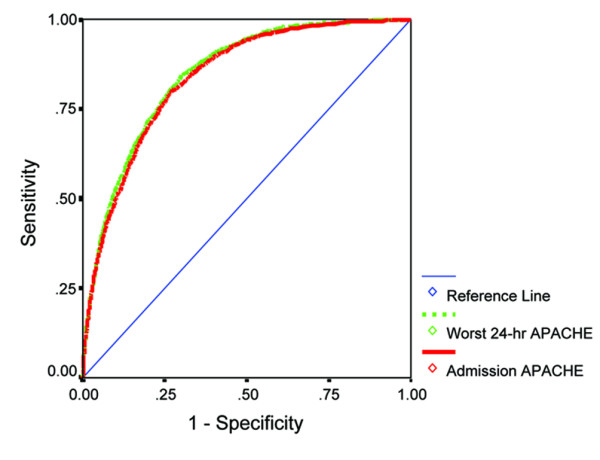
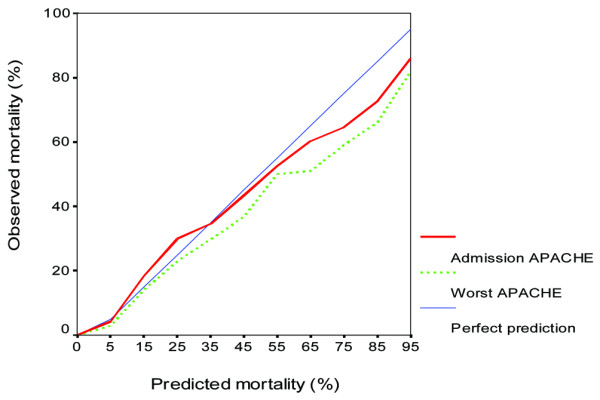
Results: There were 11,107 noncardiac surgery ICU admissions during 11 years from 1 January 1993 to 31 December 2003. The mean admission and the worst 24-hour APACHE II score were 12.7 and 15.4, and the derived predicted mortality estimates were 15.5% and 19.3%, respectively. The actual hospital mortality was 16.3%. The overall discrimination ability, as measured by the area under the receiver operating characteristic curve, of the admission APACHE II model (83.8%, 95% confidence interval = 82.9-84.7) and the worst 24-hour APACHE II model (84.6%, 95% confidence interval = 83.7-85.5) was not significantly different (P = 1.00).
Conclusion: Substitution of the worst 24-hour physiological variables with the admission physiological variables to calculate the admission APACHE II score maintains the overall discrimination ability of the traditional APACHE II model. The admission APACHE II model represents a potential alternative model to the worst 24-hour APACHE II model in critically ill nontrauma patients.
Figures
References
-
- Knaus WA, Draper EA, Wagner DP, Zimmerman JE. APACHE II: a severity of disease classification system. Crit Care Med. 1985;13:818–829. - PubMed
-
- Oh TE, Hutchinson R, Short S, Buckley T, Lin E, Leung D. Verification of the Acute Physiology and Chronic Health Evaluation scoring system in a Hong Kong intensive care unit. Crit Care Med. 1993;21:698–705. - PubMed
Publication types
MeSH terms
LinkOut - more resources
Full Text Sources
